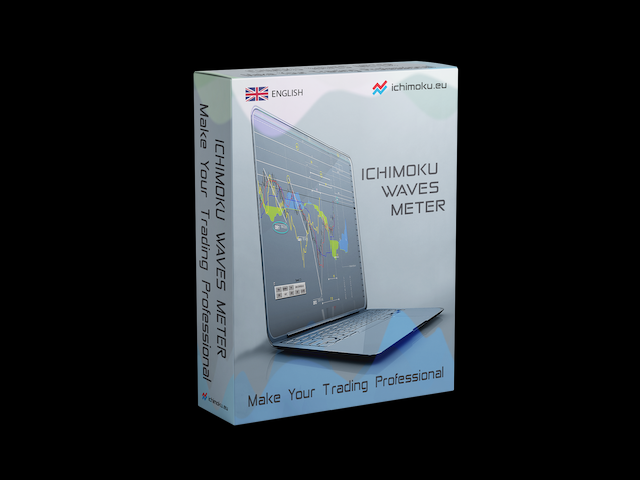
The professional utilities “Ichimoku Waves Meter” to analyse graphs using the correct interpretation of Ichimoku kinkōhyō!
Is a graphic program that allows traders to quickly and easily measure the proportions between the indicated points on the price graph. This time and price indicator is a basic tool for analysing the chart according to the Ichimoku strategy on the MT4 platform. Using this tool allows an insightful and complete analysis of time waves as well as price waves in a very short time. Effort put into performing the analysis is minimized many times in comparison with a similar measurement and calculation carried out using an excel. The indicator has been designed using the knowledge and experience of traders who use the Ichimoku kinko hyo strategy, as well as taking into account their expectations. The presented tool is the result of our work.
The modular structure of the indicator allows us to carry out the analysis in a logical sequence. The process starts from collecting data about the past waves which is then basis for calculating the future market movements. The data considered in calculations are crucial for the accuracy of the forecasts. This operation is minimized and gives an immediate measurement, which is displayed in a graphical form on the candlestick chart. Moreover, it can be personalized in many areas. The result can be presented as information on the graph in the form of values such as pips (Percentage in points), the number of candlesticks or the date of the forecasted change in the market.
The indicator allows us to use Time Theory and Target Price Theory at the same time. The obtained image shows the convergence of waves, which confirms the accuracy of the analysis. It is possible to hide the graphical or numerical informations that are not interesting at the moment. The indicator uses numerical values of Hosoda, which it recognizes on the chart and then emphasizes graphical distinction. This distinction depends on the degree of proximity to the basic numerical values. This allows the analyst to quickly draw the information of the emerging market situation, as well as indicate the stage of scenario implementation. The tool for calculating forecasted market ranges uses basic formulas for time and prices waves movements, which were derived by Hosoda. As an effect, we obtain prediction ranges from the nearest to possible further ranges in a very precise range.
The panel for automatic current measurements facilitates the work on the graph, where apart from the cycles with basic numerical values, there are also equivalent values, kakugi or jugi. When assessing the situation, it is also possible to use a panel for manual measurements. The basic schemes of Wave Movement Theory: V, N, E and NT have been supplemented with both habitual, negative and average ranges. In addition, with a high movement dynamics, a multiple of range is added, such as 2E or 3E. Depending on the measurement methodology used, make analyses both after the extremes and after closing the prices. In addition to the presented basic functions that are necessary to carry out the analysis according to the Ichimoku strategy, the indicator is also equipped with additional functions such as: analysis of candlesticks closures from a given period and presentation of the result of such measurement in the graphic form of the so-called. Kyushu legs. When analysing the cyclical nature of the market, it is also possible to use the functions of mirror reflections.
Notes:
– Preferred screen background color: “SlateGray“.
If you will be using the program in the MT4 strategy tester remember to:
– Set the test model to: “Every Tick”,
– If you want to use buttons or set measurement points you need to slow down the test significantly with the “Visual Mode” slider.
Hardware Requirements:
– Installed font: “Webdings“.
This is where you buy the Ichimoku Waves Meter program in the English version.
There are also language versions available in the store:
– Polish
– Japanese
– Russian
– Italian
Join our channel: https://www.mql5.com/en/channels/Ichimoku_Waves_Meter
In the “comments” section you will find full documentation of the programme, we encourage you to read the details.
We wish you profitable analysis.
Best regards
Ichimoku.eu Team
![图片[1]-Mql5官网 Ichimoku Waves Meter vm EN 外汇EA-EA侦探社 - 全球领先的MQL5官网外汇EA机器人MT4自动化交易EA资源免费分享网站](https://www.mql5.vip/wp-content/uploads/2024/05/20240517223313-6647db2954af3.png)
![图片[2]-Mql5官网 Ichimoku Waves Meter vm EN 外汇EA-EA侦探社 - 全球领先的MQL5官网外汇EA机器人MT4自动化交易EA资源免费分享网站](https://www.mql5.vip/wp-content/uploads/2024/05/20240517223313-6647db29e4e05.png)
![图片[3]-Mql5官网 Ichimoku Waves Meter vm EN 外汇EA-EA侦探社 - 全球领先的MQL5官网外汇EA机器人MT4自动化交易EA资源免费分享网站](https://www.mql5.vip/wp-content/uploads/2024/05/20240517223314-6647db2a7bd89.png)
![图片[4]-Mql5官网 Ichimoku Waves Meter vm EN 外汇EA-EA侦探社 - 全球领先的MQL5官网外汇EA机器人MT4自动化交易EA资源免费分享网站](https://www.mql5.vip/wp-content/uploads/2024/05/20240517223314-6647db2adc284.png)
![图片[5]-Mql5官网 Ichimoku Waves Meter vm EN 外汇EA-EA侦探社 - 全球领先的MQL5官网外汇EA机器人MT4自动化交易EA资源免费分享网站](https://www.mql5.vip/wp-content/uploads/2024/05/20240517223315-6647db2b41bf0.png)
![图片[6]-Mql5官网 Ichimoku Waves Meter vm EN 外汇EA-EA侦探社 - 全球领先的MQL5官网外汇EA机器人MT4自动化交易EA资源免费分享网站](https://www.mql5.vip/wp-content/uploads/2024/05/20240517223315-6647db2b9a915.png)
![图片[7]-Mql5官网 Ichimoku Waves Meter vm EN 外汇EA-EA侦探社 - 全球领先的MQL5官网外汇EA机器人MT4自动化交易EA资源免费分享网站](https://www.mql5.vip/wp-content/uploads/2024/05/20240517223316-6647db2c01859.png)
![图片[8]-Mql5官网 Ichimoku Waves Meter vm EN 外汇EA-EA侦探社 - 全球领先的MQL5官网外汇EA机器人MT4自动化交易EA资源免费分享网站](https://www.mql5.vip/wp-content/uploads/2024/05/20240517223316-6647db2c5c08c.png)
![图片[9]-Mql5官网 Ichimoku Waves Meter vm EN 外汇EA-EA侦探社 - 全球领先的MQL5官网外汇EA机器人MT4自动化交易EA资源免费分享网站](https://www.mql5.vip/wp-content/uploads/2024/05/20240517223316-6647db2cb8251.png)
![图片[10]-Mql5官网 Ichimoku Waves Meter vm EN 外汇EA-EA侦探社 - 全球领先的MQL5官网外汇EA机器人MT4自动化交易EA资源免费分享网站](https://www.mql5.vip/wp-content/uploads/2024/05/20240517223317-6647db2d1e5a1.png)
