
|
如果免费资源下载的文件为TXT文档 请联系站长更新!站长微信:Lv596999 Telegram:@eapoj “Mql5官网”板块的EA基本都有,大部分是无限制NODLL版,NODLL版本MT1420升级,大多数不可用!这些EA来源为国外花钱买过来的 如有需要,请联系站长! “EA测评”板块资源全部现有,看见不错的,可以联系站长,看EA在确定是否收费。 “无限制EA”板块,大部分免费,下载文件全部存在,都可以免费下载。 站长硬盘EA太多,因大部分时间做交易,做风控,没太多时间更新下载地址,请谅解! 需要更新下载文件,请联系站长微信!国外朋友请联系Telegram。  |
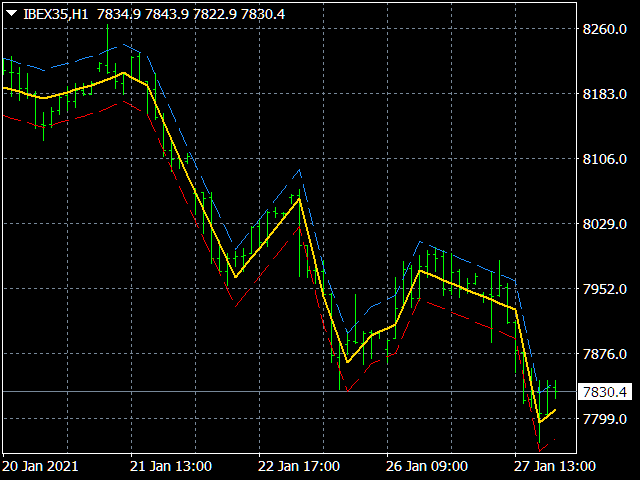
The StatZigZag indicator looks like a regular ZigZag, but is built on the basis of completely different algorithms. The StatZigZag indicator is a broken line built from segments of regression lines of different lengths, the beginning of each of which comes from the end of the previous segment. Each regression segment is built until the variance or spread of price around it begins to exceed a certain critical value, after which the construction of this segment ends and the construction of the next segment begins. This approach is due to the following. The variance of the price around the regression segment begins to grow strongly with large price jumps and with an increase in its volatility, which take place when the trend movement changes. This allows the broken line resulting from the operation of this algorithm to track the trend and the moments of its reversals.
The number of points for plotting each segment of the regression line is variable and depends on the market situation described by the indicator, but it can vary from Backstep to Depth, which are set in the indicator settings. At the same time, the smaller the Backstep, the smaller the delay with which the beginning of the trend movement is determined and the greater the resolution of the nearest price peaks. However, low Backstep values also reduce the reliability of the results. Decreasing Depth allows a trader to identify areas with a different average rate of price change on long trends.
The StatZigZag indicator also builds a channel of maximum price fluctuations around the broken regression line, on the lower (red) line of which you can set StopLoss for buy orders, and on the upper (blue) line – StopLoss for sell orders.
The indicator is resource-intensive, therefore it is recommended to reduce the number of displayed bars in the window, especially in the tester mode.
Using the StatZigZag indicator in trading.
The StatZigZag indicator, being the most optimal filter, does not react to simple price volatility and its insignificant movements. However, the last regression line of the StatZigZag indicator, like the ZigZag indicator, is redrawn. Therefore, StatZigZag is, first of all, an auxiliary tool for technical analysis, i.e. StatZigZag, just like a regular ZigZag, is best used to study the price chart – more accurate trend establishment, determination of support and resistance levels, clearer identification of various technical analysis patterns, Eliot waves, etc.
Meanwhile, StatZigZag draws a broken line not according to individual single peaks and valleys (as a regular ZigZag does), which may have the character of strong unlikely price jumps, but based on the statistics of a large set of points. Therefore, StatZigZag readings are more reliable and it redraws the last segment of the regression line to a much lesser extent than redraws the last knee of the classic ZigZag. Moreover, many ZigZag modifications do not draw the last knee at all until the criteria of the last extremum are reached. Meanwhile, the more (for a greater number of bars) the last segment of the StatZigZag indicator is drawn, the less this segment begins to redraw, then acquiring the status of a reliable signal to open a position. For this reason, StatZigZag can be used directly as a signal provider or for opening positions. In addition, the channel, also drawn by the StatZigZag indicator, allows you to reliably place StopLoss positions.
Indicator settings.
- Price type – applied price. Values: Close price, Open price, High price, Low price, Median price ((high + low)/2 default), Typical price ((high + low + close)/3), Weighted price ((high + low + 2*close)/4).
- Backstep – Minimum distance between peaks(>=3Bars) Values: any positive integer greater than 3 but less than Depth. (3 default)
- Depth – Maximum distance between peaks (<=60Bars). Values: any positive integer less than 60 but greater than Backstep. (20 default).
- Maximum price variance relative to the regression line. Values: any positive real number (1.0 default).
- Channel width factor – Factor that sets the channel width around the broken regression line. Values: any positive real number (3.0 default).
![图片[1]-Mql5官网 StatZigZag 外汇EA-EA侦探社 - 全球领先的MQL5官网外汇EA机器人MT4自动化交易EA资源免费分享网站](https://www.mql5.vip/wp-content/uploads/2024/05/20240517233657-6647ea194d6e6.png)
![图片[2]-Mql5官网 StatZigZag 外汇EA-EA侦探社 - 全球领先的MQL5官网外汇EA机器人MT4自动化交易EA资源免费分享网站](https://www.mql5.vip/wp-content/uploads/2024/05/20240517233657-6647ea19dd82c.png)
![图片[3]-Mql5官网 StatZigZag 外汇EA-EA侦探社 - 全球领先的MQL5官网外汇EA机器人MT4自动化交易EA资源免费分享网站](https://www.mql5.vip/wp-content/uploads/2024/05/20240517233658-6647ea1a72502.png)
![图片[4]-Mql5官网 StatZigZag 外汇EA-EA侦探社 - 全球领先的MQL5官网外汇EA机器人MT4自动化交易EA资源免费分享网站](https://www.mql5.vip/wp-content/uploads/2024/05/20240517233658-6647ea1ae70e5.png)
![图片[5]-Mql5官网 StatZigZag 外汇EA-EA侦探社 - 全球领先的MQL5官网外汇EA机器人MT4自动化交易EA资源免费分享网站](https://www.mql5.vip/wp-content/uploads/2024/05/20240517233659-6647ea1b86c4b.png)
![图片[6]-Mql5官网 StatZigZag 外汇EA-EA侦探社 - 全球领先的MQL5官网外汇EA机器人MT4自动化交易EA资源免费分享网站](https://www.mql5.vip/wp-content/uploads/2024/05/20240517233700-6647ea1c4a143.png)