
|
如果免费资源下载的文件为TXT文档 请联系站长更新!站长微信:Lv596999 Telegram:@eapoj “Mql5官网”板块的EA基本都有,大部分是无限制NODLL版,NODLL版本MT1420升级,大多数不可用!这些EA来源为国外花钱买过来的 如有需要,请联系站长! “EA测评”板块资源全部现有,看见不错的,可以联系站长,看EA在确定是否收费。 “无限制EA”板块,大部分免费,下载文件全部存在,都可以免费下载。 站长硬盘EA太多,因大部分时间做交易,做风控,没太多时间更新下载地址,请谅解! 需要更新下载文件,请联系站长微信!国外朋友请联系Telegram。  |
This
indicator provides the technical overview using following tools:
- Pivot
Points
- Technical
Indicators
- Moving
Averages
Pivot
Points
are calculated using five different methods:
- Classic
- Fibonacci
- Camarilla
- Woodie
- DeMark
With
the technical indicator, you can find the trading signals using the combination of
different indicators. It supports the following technical indicators:
- RSI
- Stochastic
- Stochastic
RSI
- MACD
- ADX
- CCI
- ATR
- Ultimate
Oscillator
- ROC
- Bull/Bear
Power
Moving
Averages
is used to find the direction of the trend using multiple Moving Average indicators. It calculates using the following rules:
·
Ask
< MA, it is SELL
·
Bid
> MA, it is BUY
·
Ask
> MA > Bid, it is None (no signal)
After
you attached the indicator to a chart it will show the following information on the chart:
- Pivot
point levels
- Technical
indicators, their values and the signal generated from them.
- Buy
and Sell count
- Summary:
Conclusion
- Multiple
MAs arranged by their method
- Buy
and Sell count
- Summary:
Conclusion
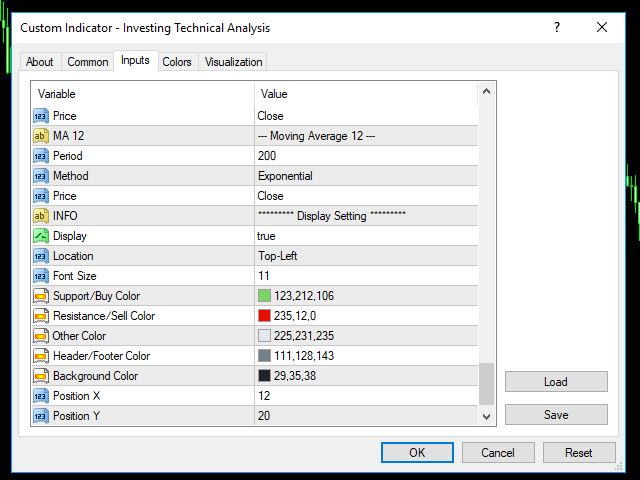
You
can hide all the information displayed in the chart by setting false to Display on Display
Setting.
![图片[1]-Mql5官网 Investing Technical Analysis Ind 外汇EA-EA侦探社 - 全球领先的MQL5官网外汇EA机器人MT4自动化交易EA资源免费分享网站](https://www.mql5.vip/wp-content/uploads/2024/05/20240518044011-6648312b9f3c4.png)
![图片[2]-Mql5官网 Investing Technical Analysis Ind 外汇EA-EA侦探社 - 全球领先的MQL5官网外汇EA机器人MT4自动化交易EA资源免费分享网站](https://www.mql5.vip/wp-content/uploads/2024/05/20240518044012-6648312c2384e.png)
![图片[3]-Mql5官网 Investing Technical Analysis Ind 外汇EA-EA侦探社 - 全球领先的MQL5官网外汇EA机器人MT4自动化交易EA资源免费分享网站](https://www.mql5.vip/wp-content/uploads/2024/05/20240518044012-6648312cb4265.png)
![图片[4]-Mql5官网 Investing Technical Analysis Ind 外汇EA-EA侦探社 - 全球领先的MQL5官网外汇EA机器人MT4自动化交易EA资源免费分享网站](https://www.mql5.vip/wp-content/uploads/2024/05/20240518044013-6648312d25052.png)
![图片[5]-Mql5官网 Investing Technical Analysis Ind 外汇EA-EA侦探社 - 全球领先的MQL5官网外汇EA机器人MT4自动化交易EA资源免费分享网站](https://www.mql5.vip/wp-content/uploads/2024/05/20240518044013-6648312d7bb26.png)
![图片[6]-Mql5官网 Investing Technical Analysis Ind 外汇EA-EA侦探社 - 全球领先的MQL5官网外汇EA机器人MT4自动化交易EA资源免费分享网站](https://www.mql5.vip/wp-content/uploads/2024/05/20240518044013-6648312dd0808.png)
![图片[7]-Mql5官网 Investing Technical Analysis Ind 外汇EA-EA侦探社 - 全球领先的MQL5官网外汇EA机器人MT4自动化交易EA资源免费分享网站](https://www.mql5.vip/wp-content/uploads/2024/05/20240518044014-6648312e324f9.png)
![图片[8]-Mql5官网 Investing Technical Analysis Ind 外汇EA-EA侦探社 - 全球领先的MQL5官网外汇EA机器人MT4自动化交易EA资源免费分享网站](https://www.mql5.vip/wp-content/uploads/2024/05/20240518044014-6648312e88ab0.png)