
|
如果免费资源下载的文件为TXT文档 请联系站长更新!站长微信:Lv596999 Telegram:@eapoj “Mql5官网”板块的EA基本都有,大部分是无限制NODLL版,NODLL版本MT1420升级,大多数不可用!这些EA来源为国外花钱买过来的 如有需要,请联系站长! “EA测评”板块资源全部现有,看见不错的,可以联系站长,看EA在确定是否收费。 “无限制EA”板块,大部分免费,下载文件全部存在,都可以免费下载。 站长硬盘EA太多,因大部分时间做交易,做风控,没太多时间更新下载地址,请谅解! 需要更新下载文件,请联系站长微信!国外朋友请联系Telegram。  |
Just $30 for six months!!!. This will draw Supply & Demand zones just by clicking on a candle. It can also draw a 50% line on the zone.
https://youtu.be/XeO_x7cpx8g
As a drawing tool, it is not active all the time after adding it to the chart.
Activate by pressing ‘s’ twice on the keyboard within a second. If activated but then decided not to draw, deactivate by pressing ‘s’ once. Box color depends if candle is above or below current price.
Features:
- Draw the box up to the last current candle or beyond to the right.
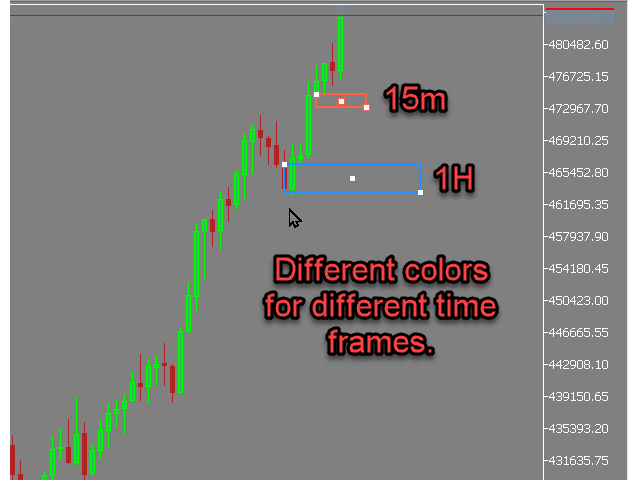
- Different colors for bearish/bullish in different TFs
- Instead of a filled box, draw it as an outlined box.
- Enable drawing a mid line at 50% of the zone.
- Draw the box pre selected
IMPORTANT: Please remember the DEMO version will only work in the Strategy Tester
This utility is helpful when using with ICT® or BTMM®.
![图片[1]-Mql5官网 Supply and Demand Draw MTF for MT4 外汇EA-EA侦探社 - 全球领先的MQL5官网外汇EA机器人MT4自动化交易EA资源免费分享网站](https://www.mql5.vip/wp-content/uploads/2024/05/20240518052949-66483ccdaf3c8.png)
![图片[2]-Mql5官网 Supply and Demand Draw MTF for MT4 外汇EA-EA侦探社 - 全球领先的MQL5官网外汇EA机器人MT4自动化交易EA资源免费分享网站](https://www.mql5.vip/wp-content/uploads/2024/05/20240518052950-66483cce5758e.png)
![图片[3]-Mql5官网 Supply and Demand Draw MTF for MT4 外汇EA-EA侦探社 - 全球领先的MQL5官网外汇EA机器人MT4自动化交易EA资源免费分享网站](https://www.mql5.vip/wp-content/uploads/2024/05/20240518052951-66483ccf016c8.png)