
|
如果免费资源下载的文件为TXT文档 请联系站长更新!站长微信:Lv596999 Telegram:@eapoj “Mql5官网”板块的EA基本都有,大部分是无限制NODLL版,NODLL版本MT1420升级,大多数不可用!这些EA来源为国外花钱买过来的 如有需要,请联系站长! “EA测评”板块资源全部现有,看见不错的,可以联系站长,看EA在确定是否收费。 “无限制EA”板块,大部分免费,下载文件全部存在,都可以免费下载。 站长硬盘EA太多,因大部分时间做交易,做风控,没太多时间更新下载地址,请谅解! 需要更新下载文件,请联系站长微信!国外朋友请联系Telegram。  |
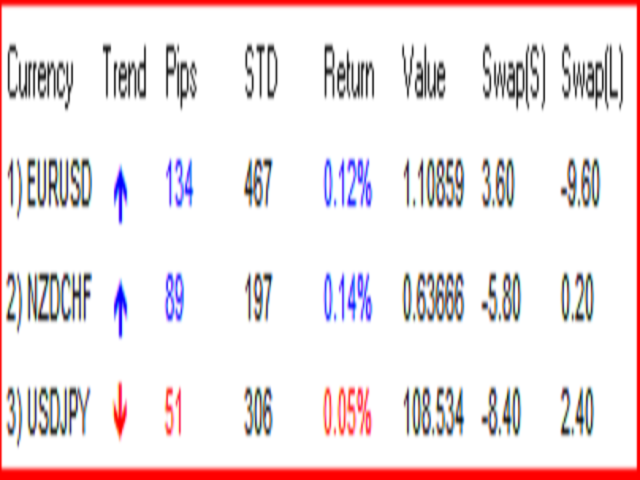
With the Market View Indicator, you may monitor in a dedicated panel as many as products as you wish. Just add the indicator to
the chart, enter the prodcuts you want to view and the change period to track and that’s it. A panel will open up at the bottom of the chart which
will show you per product the change in pips, the standard deviation, the return etc.
Personally, I use it to track multiple products I have positions with without having multiple charts opened up, it save me bandwith and time to jump
between screen. In the example, I have positions in EURUSD, USDJPY and NZDCHF, so, I just had to open the indicator once, add these currencies
with the daily change as monitoring and that’s it.
© 2019 Roy Meshulam
![图片[1]-Mql5官网 Market View Indicator 外汇EA-EA侦探社 - 全球领先的MQL5官网外汇EA机器人MT4自动化交易EA资源免费分享网站](https://www.mql5.vip/wp-content/uploads/2024/05/20240518055534-664842d6702c0.png)
![图片[2]-Mql5官网 Market View Indicator 外汇EA-EA侦探社 - 全球领先的MQL5官网外汇EA机器人MT4自动化交易EA资源免费分享网站](https://www.mql5.vip/wp-content/uploads/2024/05/20240518055535-664842d7128a9.png)