
|
如果免费资源下载的文件为TXT文档 请联系站长更新!站长微信:Lv596999 Telegram:@eapoj “Mql5官网”板块的EA基本都有,大部分是无限制NODLL版,NODLL版本MT1420升级,大多数不可用!这些EA来源为国外花钱买过来的 如有需要,请联系站长! “EA测评”板块资源全部现有,看见不错的,可以联系站长,看EA在确定是否收费。 “无限制EA”板块,大部分免费,下载文件全部存在,都可以免费下载。 站长硬盘EA太多,因大部分时间做交易,做风控,没太多时间更新下载地址,请谅解! 需要更新下载文件,请联系站长微信!国外朋友请联系Telegram。  |
Ace Supply Demand Zone Indicator
The concept of supply demand relies on the quantity mismatching between buying and selling volumes in the financial market. Supply and demand zone can provide the good entry and exit. A zone is easier to trade than a line. The supply demand zone can provide the detailed trading plan and the risk management. Its ability to predict market direction is high. There are two distinctive points about Ace Supply Demand Zone Indicator. Ace Supply Demand Zone indicator was built on the non-repainting and non-lagging principle. If you have a choice, choose non-repainting and non-lagging system always.
Since this is non repainting supply demand zone indicator, you can use the historical supply and demand zone as the horizontal support and resistance. For example, at some point, any supply and demand zone will be penetrated. Once they are penetrated, the indicator automatically achieves these supply and demand zones. The historical zone will be displayed with short box instead of the extended box in your chart. You can always extend the box again by clicking them if you wish. Even after their life ended, they can serve you to draw the great breakout or reversal zone in your chart. With the historical supply and demand zone, you can use them to improve the trading performance on top of the original supply and demand zone strategy. You can consider it as the automatic horizontal support and resistance indicator in this end. Hence, Ace Supply and Demand indicator is highly valuable comparing to any other supply and demand indicator on the internet.
Main Features
-
Multiple timeframe scanning for the important supply demand zone
-
Automatic profit target and stop loss detection for any supply demand zone
-
Daily, Weekly and Monthly Market Profile Analysis to further gauge the mean reversion characteristics of market (Value area and point of control calculation included.)
-
Daily, Weekly, Monthly Pivot Analysis to improve your mean reversion analysis
-
Capability to do multiple time frame analysis on the same chart (Recommended to use no more than two zones per chart)
-
Automatic Retouch detection of each supply demand zone. (Easy to identify which zone is virgin and which are not.)
-
Sound, Email, Push notification is possible when any supply demand zone is touched or detected
Trading Direction
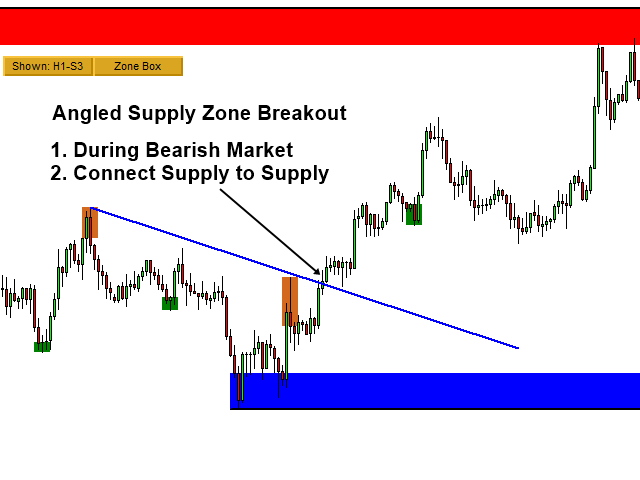
You can perform the typical supply and demand zone trading. For example, you can use Supply and Demand Zone to predict market direction (Drop Base Rally pattern, Rally Base Drop pattern, Rally Base Rally pattern, Drop Base Drop pattern). Secondly, you can also use the supply demand zone as the horizontal support and resistance. On top of that, you can use Market Profile as an additional decision making tool.
About Market Profile
This indicator offers daily, weekly and monthly Market Profile to gauge the odds of the mean reversion for the market. To construct the market profile, the timeframe for chart must be carefully chosen for the proper calculation of Market Profile. Normally it is important to recognize the price movement outside the value area.
-
Daily Market Profile: M5 to H1 timeframe can be used. M30 is recommended.
-
Weekly Market Profile: M30 to H4 timeframe can be used. H1 is recommended.
-
Monthly Market Profile: H1 to D1 timeframe can be used. H4 is recommended.
Trading Strategy Guide
The good trading strategy guide for the supply demand trading can be fround from Technical Analysis in Forex and Stock Market (Supply Demand Analysis and Support Resistance, 2021). In addition, you can also use the book: Science Of Support, Resistance, Fibonacci Analysis, Harmonic Pattern, Elliott Wave and X3 Chart Pattern (In Forex and Stock Market Trading, 2021) to find out the explanation for support and resistance as well as other advanced technical anaysis. Please visit the link below for more details about the trading strategy guide with supply demand zone trading.
Supply Demand Zone Trading Guide: https://www.mql5.com/en/blogs/post/750386
Important Note
This is the off the shelf product. Therefore, we do not accept any modification or customization request on this product. In addition, we do not provide any code library or any support for your coding for this product.
![图片[1]-Mql5官网 Ace Supply Demand Zone MT4 外汇EA-EA侦探社 - 全球领先的MQL5官网外汇EA机器人MT4自动化交易EA资源免费分享网站](https://www.mql5.vip/wp-content/uploads/2024/05/20240520095431-664b1dd7e55b4.png)
![图片[2]-Mql5官网 Ace Supply Demand Zone MT4 外汇EA-EA侦探社 - 全球领先的MQL5官网外汇EA机器人MT4自动化交易EA资源免费分享网站](https://www.mql5.vip/wp-content/uploads/2024/05/20240520095433-664b1dd94cbed.png)
![图片[3]-Mql5官网 Ace Supply Demand Zone MT4 外汇EA-EA侦探社 - 全球领先的MQL5官网外汇EA机器人MT4自动化交易EA资源免费分享网站](https://www.mql5.vip/wp-content/uploads/2024/05/20240520095434-664b1dda73d2f.png)
![图片[4]-Mql5官网 Ace Supply Demand Zone MT4 外汇EA-EA侦探社 - 全球领先的MQL5官网外汇EA机器人MT4自动化交易EA资源免费分享网站](https://www.mql5.vip/wp-content/uploads/2024/05/20240520095436-664b1ddcb6c5e.png)
![图片[5]-Mql5官网 Ace Supply Demand Zone MT4 外汇EA-EA侦探社 - 全球领先的MQL5官网外汇EA机器人MT4自动化交易EA资源免费分享网站](https://www.mql5.vip/wp-content/uploads/2024/05/20240520095438-664b1ddedf4c5.png)
![图片[6]-Mql5官网 Ace Supply Demand Zone MT4 外汇EA-EA侦探社 - 全球领先的MQL5官网外汇EA机器人MT4自动化交易EA资源免费分享网站](https://www.mql5.vip/wp-content/uploads/2024/05/20240520095441-664b1de13ea41.png)
![图片[7]-Mql5官网 Ace Supply Demand Zone MT4 外汇EA-EA侦探社 - 全球领先的MQL5官网外汇EA机器人MT4自动化交易EA资源免费分享网站](https://www.mql5.vip/wp-content/uploads/2024/05/20240520095443-664b1de3a7194.png)
![图片[8]-Mql5官网 Ace Supply Demand Zone MT4 外汇EA-EA侦探社 - 全球领先的MQL5官网外汇EA机器人MT4自动化交易EA资源免费分享网站](https://www.mql5.vip/wp-content/uploads/2024/05/20240520095444-664b1de4bed22.png)
![图片[9]-Mql5官网 Ace Supply Demand Zone MT4 外汇EA-EA侦探社 - 全球领先的MQL5官网外汇EA机器人MT4自动化交易EA资源免费分享网站](https://www.mql5.vip/wp-content/uploads/2024/05/20240520095445-664b1de589d26.png)
![图片[10]-Mql5官网 Ace Supply Demand Zone MT4 外汇EA-EA侦探社 - 全球领先的MQL5官网外汇EA机器人MT4自动化交易EA资源免费分享网站](https://www.mql5.vip/wp-content/uploads/2024/05/20240520095446-664b1de63358a.png)
![图片[11]-Mql5官网 Ace Supply Demand Zone MT4 外汇EA-EA侦探社 - 全球领先的MQL5官网外汇EA机器人MT4自动化交易EA资源免费分享网站](https://www.mql5.vip/wp-content/uploads/2024/05/20240520095446-664b1de6b0155.png)