
|
如果免费资源下载的文件为TXT文档 请联系站长更新!站长微信:Lv596999 Telegram:@eapoj “Mql5官网”板块的EA基本都有,大部分是无限制NODLL版,NODLL版本MT1420升级,大多数不可用!这些EA来源为国外花钱买过来的 如有需要,请联系站长! “EA测评”板块资源全部现有,看见不错的,可以联系站长,看EA在确定是否收费。 “无限制EA”板块,大部分免费,下载文件全部存在,都可以免费下载。 站长硬盘EA太多,因大部分时间做交易,做风控,没太多时间更新下载地址,请谅解! 需要更新下载文件,请联系站长微信!国外朋友请联系Telegram。  |
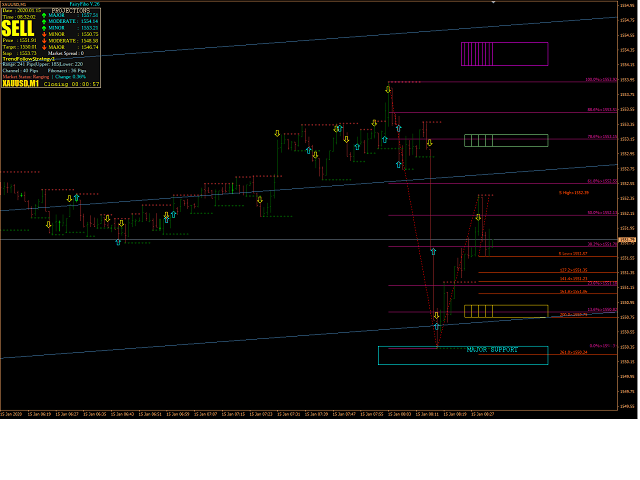
FairyFibo can generate as many as 70 different BUY signals and 70 different SELL signals solely based on Price Action and Fibonacci levels. The idea is to catch as many as Swing High’s and Swing Low’s but with the consideration of the current trend mind. This indicator can be also used for Binary Options Trading as most of the time price tends to follow the signal direction immediately. Most of the strategies are already optimized for different time frames and different market conditions. While in practical you will not need that many strategies to develop a profitable system. The idea for presenting all the possibilities here is for the reason that each market behaves differently and they have their own characteristics. In any case if you found any strategy that is not performing well for a given market then you can always deselect those strategies. Before testing it in strategy tester make sure that you have atleast 90% quality data and no mismatched chart errors. Before going to trade live you should spend 4-5 weeks of time to get used to with the signals that you have selected for a specific market. If you are an experienced Price Action and Fibonacci trader then this is going to be your dream tool.
Product Home Page: https://www.mql5.com/en/market/product/35339
ADVANTAGES:
Interactive Fibonacci Retracement and Extension tool
Interactive Regression Channel
Interactive Support and Resistance levels
Works on any market and any time frames.
Offers Profit target along side BUY/SELL signals
Good at catching Swing Highs and Swing Lows.
No repainting at all.
Absolute freedom to Activate/Deactivate signals
Voice Alert for Fibonacci levels, Support and Resistance levels, Swing High, Swing Low, Regression Channel, and BUY and SELL signals
Email Alert for BUY and SELL signals
Mobile Notification for BUY and SELL signals
Flash Alert for Fibonacci levels, Support and Resistance levels, and Regression Channel
Smart Info Panel with significant Price Action information about the market
Lines Description:
Larger horizontal lines are Retracement levels. Green means uptrend. Red means downtrend.
Smaller horizontal lines are Extension levels. Green means uptrend. Red means downtrend.
Three parallel blue lines are Regression channel lines. Channel pointing upwards means uptrend, pointing downwards means down trend. Flat means range bound.
Small dotted lines are short term Support and Resistance lines.
If you would like to strengthen your Fibonacci analysis alongside moving average indicators the please try my free Moving average indicator https://www.mql5.com/en/market/product/46412
Attention!!!!
This product has been released only on MQL5.COM. I do not sell this product on any other sites.
![图片[1]-Mql5官网 FairyFibo 外汇EA-EA侦探社 - 全球领先的MQL5官网外汇EA机器人MT4自动化交易EA资源免费分享网站](https://www.mql5.vip/wp-content/uploads/2024/05/20240520114750-664b38661e3de.png)