
|
如果免费资源下载的文件为TXT文档 请联系站长更新!站长微信:Lv596999 Telegram:@eapoj “Mql5官网”板块的EA基本都有,大部分是无限制NODLL版,NODLL版本MT1420升级,大多数不可用!这些EA来源为国外花钱买过来的 如有需要,请联系站长! “EA测评”板块资源全部现有,看见不错的,可以联系站长,看EA在确定是否收费。 “无限制EA”板块,大部分免费,下载文件全部存在,都可以免费下载。 站长硬盘EA太多,因大部分时间做交易,做风控,没太多时间更新下载地址,请谅解! 需要更新下载文件,请联系站长微信!国外朋友请联系Telegram。  |
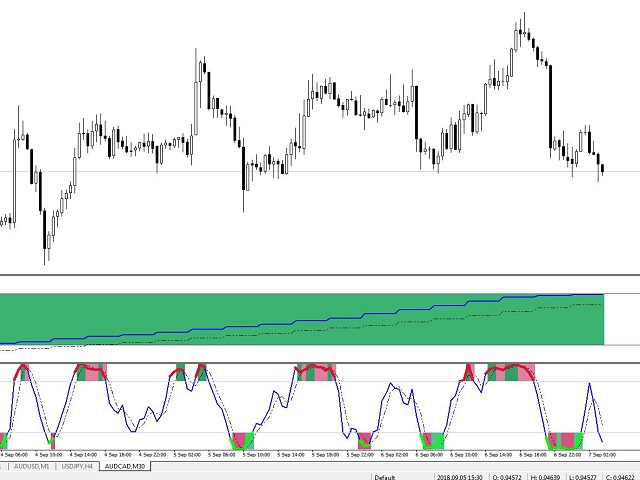
EZT_Stochastic
This is a Multi Timeframe stochastic indicator, with colored
background. The colored background can be set to different colors based on the
K and D line, (moving up, or down), and also about the position of the lines.
In
the oversold or overbought zones you can choose different colors.
Settings:
You can choose the time-frame you want to see the stochastic.
Set the regular parameters in a same way like in the
original stochastic.
- Histogram style: The style.
- Histogram width: The width.
- Histogram Drawing: Choose from 3 options: “No Histogram”, “Full
Histogram”, or “Partial Histogram” (See
picture examples.)
You can set the oversold and overbought levels. (The default
are: 20-80)
The background colors:
- Oversold UP color: The stochastic are below the 20 level and
K line crossed D line up.
- Up color: The stochastic K line crossed up the 20 levels and
goes until the D line crossed up the 80 level, or the K line cross D line down.
- Overbought up color: The stochastic D line crossed up 80
level, and goes until K line cross down the D line.
- Overbought down: The stochastic are above the 80 level and K
line crossed D line down.
- Down color: The stochastic K line crossed down the 80 levels
and goes until the D line crossed down the 20 level, or the K line cross D line
up.
- Oversold down: The stochastic D line crossed down 20 level, and
goes until K line cross up the D line.
You can chose the levels color and style.
You can chose the stochastic K and D line style, width and
color, and for the K line you can set separate colors for oversold and
overbought zones.
![图片[1]-Mql5官网 EZT Stochastic 外汇EA-EA侦探社 - 全球领先的MQL5官网外汇EA机器人MT4自动化交易EA资源免费分享网站](https://www.mql5.vip/wp-content/uploads/2024/05/20240520132815-664b4fef6b7cd.jpeg)
![图片[2]-Mql5官网 EZT Stochastic 外汇EA-EA侦探社 - 全球领先的MQL5官网外汇EA机器人MT4自动化交易EA资源免费分享网站](https://www.mql5.vip/wp-content/uploads/2024/05/20240520132816-664b4ff01eecc.jpeg)
![图片[3]-Mql5官网 EZT Stochastic 外汇EA-EA侦探社 - 全球领先的MQL5官网外汇EA机器人MT4自动化交易EA资源免费分享网站](https://www.mql5.vip/wp-content/uploads/2024/05/20240520132816-664b4ff0c9ec4.jpeg)
![图片[4]-Mql5官网 EZT Stochastic 外汇EA-EA侦探社 - 全球领先的MQL5官网外汇EA机器人MT4自动化交易EA资源免费分享网站](https://www.mql5.vip/wp-content/uploads/2024/05/20240520132818-664b4ff20813a.jpeg)