
|
如果免费资源下载的文件为TXT文档 请联系站长更新!站长微信:Lv596999 Telegram:@eapoj “Mql5官网”板块的EA基本都有,大部分是无限制NODLL版,NODLL版本MT1420升级,大多数不可用!这些EA来源为国外花钱买过来的 如有需要,请联系站长! “EA测评”板块资源全部现有,看见不错的,可以联系站长,看EA在确定是否收费。 “无限制EA”板块,大部分免费,下载文件全部存在,都可以免费下载。 站长硬盘EA太多,因大部分时间做交易,做风控,没太多时间更新下载地址,请谅解! 需要更新下载文件,请联系站长微信!国外朋友请联系Telegram。  |
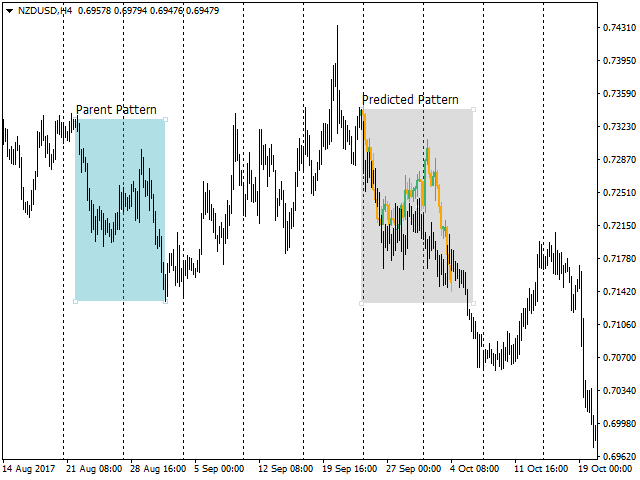
The indicator compares pattern found on chart history with the current price movement. Since history repeats itself, then, by comparing the two patterns, indicator can predict the further movement of the price. The indicator allows you to overlay highlighted history pattern with current movement and you will visually see this movement and will be able to compare the past and the present.
To compare two patterns, you need:
- It is necessary to find and highlight a pattern on the history chart of a currency pair
- Then mark the beginning of price movement from which the historical pattern will be overlaid
How to work with the indicator
- If you have found a pattern that you want to overlay to current price movement, select this pattern using the rectangle tool. This rectangle must be called “parent”. Open the parameters of the rectangle instrument and enter “parent” in the “Name” field. NB! all the letters are small!
- Next, you must indicate the beginning of the price movement, from which the found historical pattern will be overlaid. To do this, you can also use the rectangle tool. This rectangle must be called “child”. Open the parameters of the rectangle and enter “child” in the “Name” field NB! all the letters are small!
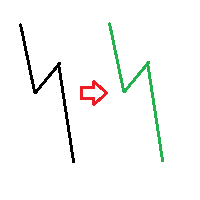
It is better to compare one-way movements or patterns. For example, if the “parent” pattern is moving down with a rollback, then it should be applied to the current downward movement (possibly with a rollback). And vice versa for an upward movement or more complex patterns.
How to mark a pattern
To highlight a pattern on a history chart, use the Rectangle tool. It can be stretched in length and width. The width of the rectangle determines how many candles should be in the pattern. The height of the rectangle determines the max/min of the selected pattern.
Select the pattern as follows, for example:
- If there is a pattern with the down movement, then the rectangle should be drawn from the top candle and from the high of this candle.
- If there is a pattern with the up movement, then the rectangle should be drawn from the lower candle and from the low of this candle.
Drawing “parent” and “child” rectangles must match, so if “parent” is drawn from top to bottom (from the high), then you should draw “child” from top to bottom of the high of first candle. For the upward movement, the opposite of the same rule is valid. Rectangles are drawn from the candlestick low.
Features
- showComments – specifies whether to show additional information or not. Information about the direction of the rectangles is shown. This information will help to quickly determine how a rectangle is drawn, it is important to correctly overlay the parent pattern on the analyzed pattern.
- showCandlesOnBackground – Specifies how to draw an overlay parent chart on the analyzed graph. Draw behind the main (current) chart or in the background.
- BullBarColor – Specifies the color of a bullish candle
- BearBarColor – Determines the color of the bearish candles
![图片[1]-Mql5官网 Visual comparison of history and current patterns 外汇EA-EA侦探社 - 全球领先的MQL5官网外汇EA机器人MT4自动化交易EA资源免费分享网站](https://www.mql5.vip/wp-content/uploads/2024/05/20240520154319-664b6f97e9c36.png)
![图片[2]-Mql5官网 Visual comparison of history and current patterns 外汇EA-EA侦探社 - 全球领先的MQL5官网外汇EA机器人MT4自动化交易EA资源免费分享网站](https://www.mql5.vip/wp-content/uploads/2024/05/20240520154320-664b6f988f309.png)
![图片[3]-Mql5官网 Visual comparison of history and current patterns 外汇EA-EA侦探社 - 全球领先的MQL5官网外汇EA机器人MT4自动化交易EA资源免费分享网站](https://www.mql5.vip/wp-content/uploads/2024/05/20240520154321-664b6f9913852.png)