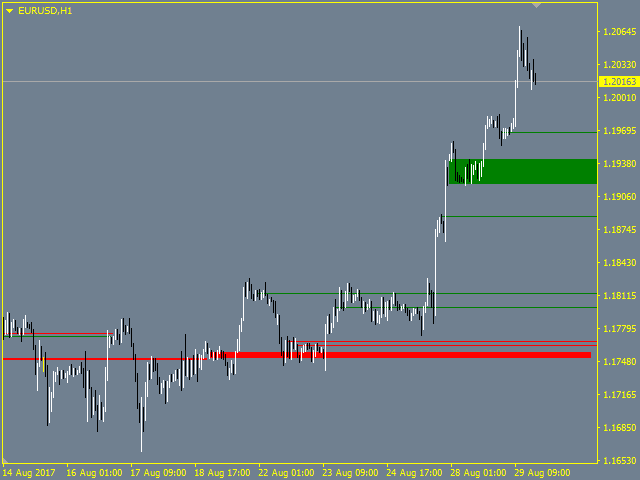
The indicator finds and visualizes price gaps, which often can be used as support and resistance levels. It can display levels from different timeframes on one chart.
Inputs Value
- Label – show/hide the timeframe of constructed levels
- TimeFrame – select timeframe to draw levels from
- DrawRangeDay – the length of the level in days
- DrawRangeHour – the length of the level in hours
- GapSizeForDrawing – a level will be drawn if gap is equal to or larger than this level in points
- CountDays – the number of days to search or price gaps
- GAP_UP – the color of the upper gap
- GAP_DOWN – the color of the lower gap
- Label_X, Label_Y – coordinates of the label showing the timeframe of levels
![图片[1]-Mql5官网 MOR Smart Gap 外汇EA-EA侦探社 - 全球领先的MQL5官网外汇EA机器人MT4自动化交易EA资源免费分享网站](https://www.mql5.vip/wp-content/uploads/2024/05/20240520162045-664b785def169.png)
![图片[2]-Mql5官网 MOR Smart Gap 外汇EA-EA侦探社 - 全球领先的MQL5官网外汇EA机器人MT4自动化交易EA资源免费分享网站](https://www.mql5.vip/wp-content/uploads/2024/05/20240520162046-664b785ead517.png)
![图片[3]-Mql5官网 MOR Smart Gap 外汇EA-EA侦探社 - 全球领先的MQL5官网外汇EA机器人MT4自动化交易EA资源免费分享网站](https://www.mql5.vip/wp-content/uploads/2024/05/20240520162047-664b785f6ce14.png)
![图片[4]-Mql5官网 MOR Smart Gap 外汇EA-EA侦探社 - 全球领先的MQL5官网外汇EA机器人MT4自动化交易EA资源免费分享网站](https://www.mql5.vip/wp-content/uploads/2024/05/20240520162048-664b7860278b0.png)

© 版权声明
文章版权归作者所有,未经允许请勿转载。
THE END


