
|
如果免费资源下载的文件为TXT文档 请联系站长更新!站长微信:Lv596999 Telegram:@eapoj “Mql5官网”板块的EA基本都有,大部分是无限制NODLL版,NODLL版本MT1420升级,大多数不可用!这些EA来源为国外花钱买过来的 如有需要,请联系站长! “EA测评”板块资源全部现有,看见不错的,可以联系站长,看EA在确定是否收费。 “无限制EA”板块,大部分免费,下载文件全部存在,都可以免费下载。 站长硬盘EA太多,因大部分时间做交易,做风控,没太多时间更新下载地址,请谅解! 需要更新下载文件,请联系站长微信!国外朋友请联系Telegram。  |
The indicator uses a mechanical approach to identify resistance/support zones and assess their levels of strength showing which price zones are more important than others.
Resistance and Support are the main leading indicators used by most traders around the world. To be a successful trader, every trader needs to master the proper detection of price zones.
This indicator was created to avoid subjectivity rules when drawing support/resistance zones.
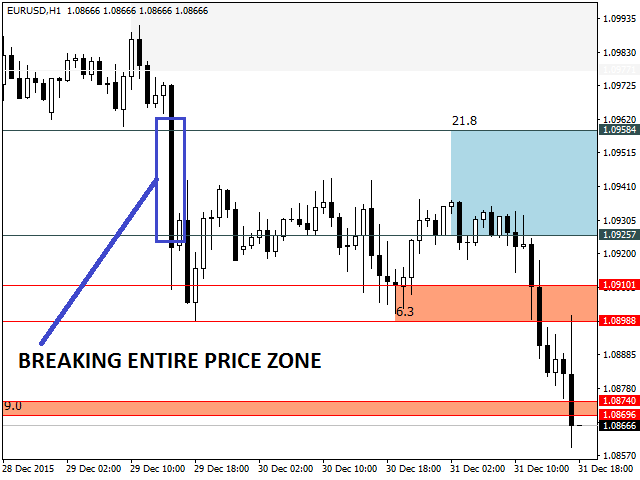
Most of the time, resistance and support are not a simple line dividing the price chart, but a price zone, where the market react when touching it.
The price action can perform a reversal or a breakout when reaching important price zones, thus generating trading opportunities.
Operation
The indicator searches for recent tops and bottoms to build the resistance/support zones.
After price zones are built, the indicator makes a clustering only for the overlapping price zones (tip: Avoid increasing so much the number of top/bottom parameter. It generally will result in larger price zones).
Finally, the indicator assesses the strength level for each price zone.
Automatic Strength Filter
A strength level of a zone is measured analyzing the price action when market reaches these price zones.
A price zone with a higher level of strength means that the price action tends to correspond strongly to this price area.
The indicator was built to analyze the strengths and weaknesses of a price zone, showing a level of strength for each zone drawn on a chart.
The trader could apply a strength level filter and the indicator will smooth the weaker price zones.
The following criterias are used to determine the level strength of a price zone:
- How many times the price zone worked as a barrier to the price advancing in the recent past.
- How many times the price used this area as a support or resistance in the recent past.
- How many times the price reacted strongly when reaching this price zone in the recent past.
Analyzing the criterias above, the indicator is capable to establish positive or negative points for each price zone.
Manual Filter
Besides the Automatic Strength Filter, the user can turn on/off manually a specific price zone clicking in their respective checkbox.
Key features
- Display resistance and support zones according to their level strength, smoothing weak price zones if filter is applied.
- Can be used in conjunction with higher timeframes.
- Automatic update of the prices zones as new tops and bottoms are formed, avoiding to turn the chart into a mess of lines.
- Due strength level of each price zones, price zones can be compared and traders can focus on the stronger ones.
- Works on every symbol and timeframe.
- Executed only once a new bar is formed.
- Low input parameters to adjust.
- Accessible buffers for EA developers.
Settings
- Timeframe – timeframe used to build price zones.
- Strength Filter – enable/disable the strength filter. When enabled, stronger price zones will be highlighted and weaker price zones will be smoothed.
- Strength Filter Level – level used to filter stronger price zones from the weaker ones (Standard=8).
- Number of Tops/Bottoms – number of recent tops and bottoms that the indicator will search to build the price zones (Standard=5).
- Support Line Color – color of the horizontal lines of the support zones.
- Resistance Line Color – color of the horizontal lines of the resistance zones.
- Support Zone Color – color of the support zones.
- Resistance Zone Color – color of the resistance zones.
- Weak Color Zone – color of the weak zones.
- Checkbox Color – Color of price zones checkboxes.
- Hidden Zone Color – Color of hidden price zones (manual filter).
For EA developers
Available buffers:
- Buffers 0 and 3 – lower price zone for resistance and support respectively.
- Buffers 1 and 4 – upper price zone for resistance and support respectively.
- Buffers 2 and 5 – strength level for resistance and support zones respectively.
The information of price zones always will be stored in the beginning of the buffers. The rest of the buffers will be filled with zeros.
How to Trade?
Alone, the price zones cannot serve as entry points, but in conjunction with other indicators, like candle patterns, correlation and oscillators, they become a powerful tool. The video below contains a trading strategy using Stochastic oscillator.
https://www.youtube.com/watch?v=L2H1CW_MrBk
![图片[1]-Mql5官网 Resistance and Support Zones 外汇EA-EA侦探社 - 全球领先的MQL5官网外汇EA机器人MT4自动化交易EA资源免费分享网站](https://www.mql5.vip/wp-content/uploads/2024/05/20240521002931-664beaeb3f2e2.png)
![图片[2]-Mql5官网 Resistance and Support Zones 外汇EA-EA侦探社 - 全球领先的MQL5官网外汇EA机器人MT4自动化交易EA资源免费分享网站](https://www.mql5.vip/wp-content/uploads/2024/05/20240521002935-664beaef27b69.png)
![图片[3]-Mql5官网 Resistance and Support Zones 外汇EA-EA侦探社 - 全球领先的MQL5官网外汇EA机器人MT4自动化交易EA资源免费分享网站](https://www.mql5.vip/wp-content/uploads/2024/05/20240521002940-664beaf408f4a.png)
![图片[4]-Mql5官网 Resistance and Support Zones 外汇EA-EA侦探社 - 全球领先的MQL5官网外汇EA机器人MT4自动化交易EA资源免费分享网站](https://www.mql5.vip/wp-content/uploads/2024/05/20240521002944-664beaf8e69fb.png)
![图片[5]-Mql5官网 Resistance and Support Zones 外汇EA-EA侦探社 - 全球领先的MQL5官网外汇EA机器人MT4自动化交易EA资源免费分享网站](https://www.mql5.vip/wp-content/uploads/2024/05/20240521002948-664beafc5c730.png)
![图片[6]-Mql5官网 Resistance and Support Zones 外汇EA-EA侦探社 - 全球领先的MQL5官网外汇EA机器人MT4自动化交易EA资源免费分享网站](https://www.mql5.vip/wp-content/uploads/2024/05/20240521002952-664beb00219d9.png)
![图片[7]-Mql5官网 Resistance and Support Zones 外汇EA-EA侦探社 - 全球领先的MQL5官网外汇EA机器人MT4自动化交易EA资源免费分享网站](https://www.mql5.vip/wp-content/uploads/2024/05/20240521002954-664beb02d01e0.png)
![图片[8]-Mql5官网 Resistance and Support Zones 外汇EA-EA侦探社 - 全球领先的MQL5官网外汇EA机器人MT4自动化交易EA资源免费分享网站](https://www.mql5.vip/wp-content/uploads/2024/05/20240521002958-664beb06c5200.png)
![图片[9]-Mql5官网 Resistance and Support Zones 外汇EA-EA侦探社 - 全球领先的MQL5官网外汇EA机器人MT4自动化交易EA资源免费分享网站](https://www.mql5.vip/wp-content/uploads/2024/05/20240521003001-664beb09a99f0.png)
![图片[10]-Mql5官网 Resistance and Support Zones 外汇EA-EA侦探社 - 全球领先的MQL5官网外汇EA机器人MT4自动化交易EA资源免费分享网站](https://www.mql5.vip/wp-content/uploads/2024/05/20240521003004-664beb0c58887.png)
![图片[11]-Mql5官网 Resistance and Support Zones 外汇EA-EA侦探社 - 全球领先的MQL5官网外汇EA机器人MT4自动化交易EA资源免费分享网站](https://www.mql5.vip/wp-content/uploads/2024/05/20240521003006-664beb0e1e9fc.png)