
|
如果免费资源下载的文件为TXT文档 请联系站长更新!站长微信:Lv596999 Telegram:@eapoj “Mql5官网”板块的EA基本都有,大部分是无限制NODLL版,NODLL版本MT1420升级,大多数不可用!这些EA来源为国外花钱买过来的 如有需要,请联系站长! “EA测评”板块资源全部现有,看见不错的,可以联系站长,看EA在确定是否收费。 “无限制EA”板块,大部分免费,下载文件全部存在,都可以免费下载。 站长硬盘EA太多,因大部分时间做交易,做风控,没太多时间更新下载地址,请谅解! 需要更新下载文件,请联系站长微信!国外朋友请联系Telegram。  |
This indicator is based on two principles of technical analysis of the trend:
- The current trend is more likely to continue than change its direction.
- The trend will move in the same direction until it weakens.
The indicator analyzes the current direction and strength of a short term trend, measures its maximum values on the current bar, performs calculation and outputs the average value of the greatest measurements of the bullish and bearish trend.
The indicator is displayed on the M30, H1, H4 and D1 timeframes. Originally the indicator was developed by me for scalping, but it is also suitable for trend-following strategies. The recommended timeframes for scalping are M30, H1 and H4; for trend-following strategies – D1.
It is easy to work with this indicator both in manual and in automatic modes.
For manual trading, it is possible to send e-mail messages and play sound notifications when a buy or sell signal appears.
Once loaded in the terminal, the indicator starts working with tick history, it analyzes and remembers it. Therefore, to obtain the most accurate data on the current strength of the trend, it is better to refer to the global variables of the terminal created by the EA. This is especially important when working on the M30, H1 and H4 timeframes (requires the indicator to be loaded on the chart). The indicator data can also be obtained by standard means using the indicator buffers. Contact me to receive more detailed information and tips on accessing the indicator data in automatic mode and creating automated trading systems based on Trend Strength.
Features of the Trend Strength indicator
- Does not use third-party indicators.
- Works with the tick history.
- Does not redraw.
- Since it works with the tick history, it is not tied to the chart timeframe when calculating the trend strength.
- Displayed on the M30, H1, H4 and D1 timeframes.
- Sends e-mail messages and plays sound alerts.
- Access to the indicator values not only via the indicator buffers, but also using the global variables of the terminal directly (required the indicator to be running on the selected instrument).
- Messages output by the indicator to the Experts log are available in English and Russian.
Indicator Input Parameters
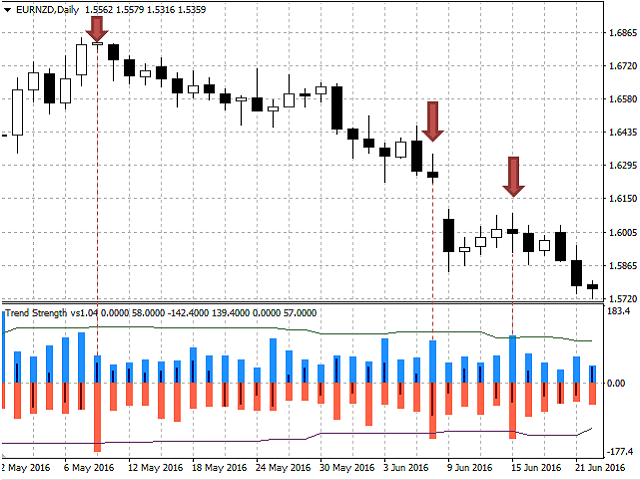
The indicator has 9 input parameters. The first 4 parameters are responsible for calculation of the averaged maximum (or required) strength values of bullish and bearish trend for the selected history interval (green and purple lines in the indicator window):
- To use different fixed numbers of the trend – if this parameter is set to “true”, the line calculation considers the values of strength with values greater than or equal to the specified. If “false”, the calculation considers the specified number of bars with the greatest values of trend strength (separately for bullish and bearish trend).
- Fixed numbers of the trend – specified value of trend strength (the parameter is used if “To use different fixed numbers of the trend” = true).
- Number of bars to calculate average numbers – specified number of bars with the greatest values of trend strength (the parameter is used if “To use different fixed numbers of the trend” = false).
- Number of bars for analysis – selected history interval.
The following four parameters set the conditions of receiving trade signals and the method of their generation:
- Type message – send notifications when a trade signal appears (Journal – to the Experts Journal, EMail – to e-mail, MessageOFF – do not send notifications).
- Give sound signal – sound alert (enable/disable).
- Alert settings – setting for signal generation condition: exceeding the specified trend strength ((Alert settings = FixNumber), crossing of the green or purple line (Alert settings = SignalLine), or if both conditions are met (Alert settings = SignalLine_and_FixNumber).
- The fixed strength of the trend – specified trend strength.
The last parameter defines the number of bars in the most recent history for the indicator to calculate its values:
- Size history bar – the number of bars.
The blue and red wide columns of the indicator display the data on the greatest strength of a bullish and bearish trend, respectively, which were recorded during the bar formation. The thin columns of the indicator display the data on the strength of the current trend (for the current bar) and the strength of the trend at the moment of bar closure (for completed bars).
Tips for trading with the Trend Strength indicator
- If you use the M30, H1 and H4 timeframes for trading, you should use the trading instruments with the least spreads, such as EURUSD, GBRUSD, etc.
- It is recommended to choose the trading time, at during which the selected instruments are the most volatile.
![图片[1]-Mql5官网 Trend Strength 外汇EA-EA侦探社 - 全球领先的MQL5官网外汇EA机器人MT4自动化交易EA资源免费分享网站](https://www.mql5.vip/wp-content/uploads/2024/05/20240521003025-664beb21cf46d.png)
![图片[2]-Mql5官网 Trend Strength 外汇EA-EA侦探社 - 全球领先的MQL5官网外汇EA机器人MT4自动化交易EA资源免费分享网站](https://www.mql5.vip/wp-content/uploads/2024/05/20240521003030-664beb2642fed.png)
![图片[3]-Mql5官网 Trend Strength 外汇EA-EA侦探社 - 全球领先的MQL5官网外汇EA机器人MT4自动化交易EA资源免费分享网站](https://www.mql5.vip/wp-content/uploads/2024/05/20240521003035-664beb2b675fa.png)
![图片[4]-Mql5官网 Trend Strength 外汇EA-EA侦探社 - 全球领先的MQL5官网外汇EA机器人MT4自动化交易EA资源免费分享网站](https://www.mql5.vip/wp-content/uploads/2024/05/20240521003039-664beb2fcabc7.png)
![图片[5]-Mql5官网 Trend Strength 外汇EA-EA侦探社 - 全球领先的MQL5官网外汇EA机器人MT4自动化交易EA资源免费分享网站](https://www.mql5.vip/wp-content/uploads/2024/05/20240521003044-664beb3456d87.png)
![图片[6]-Mql5官网 Trend Strength 外汇EA-EA侦探社 - 全球领先的MQL5官网外汇EA机器人MT4自动化交易EA资源免费分享网站](https://www.mql5.vip/wp-content/uploads/2024/05/20240521003047-664beb37eda6e.png)