|
如果免费资源下载的文件为TXT文档 请联系站长更新!站长微信:Lv596999 Telegram:@eapoj “Mql5官网”板块的EA基本都有,大部分是无限制NODLL版,NODLL版本MT1420升级,大多数不可用!这些EA来源为国外花钱买过来的 如有需要,请联系站长! “EA测评”板块资源全部现有,看见不错的,可以联系站长,看EA在确定是否收费。 “无限制EA”板块,大部分免费,下载文件全部存在,都可以免费下载。 站长硬盘EA太多,因大部分时间做交易,做风控,没太多时间更新下载地址,请谅解! 需要更新下载文件,请联系站长微信!国外朋友请联系Telegram。  |
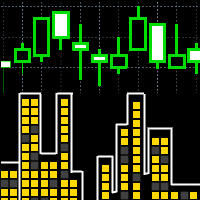
The indicator displays ZigZag lines from a higher timeframe (see the example in the screenshot). The red thin line is the current timeframe’s ZigZag, while a thicker yellow line is the higher timeframe’s one. The indicator is repainted as the data is updated.
Parameters
- Depth, Dev, Back – ZigZag parameters;
- BarsCount – amount of processed bars (reduces the initial download time and decreases the load when using in an EA);
- TimeFrame – indicator timeframe (cannot be lower than the current one).

© 版权声明
文章版权归作者所有,未经允许请勿转载。
THE END