
|
如果免费资源下载的文件为TXT文档 请联系站长更新!站长微信:Lv596999 Telegram:@eapoj “Mql5官网”板块的EA基本都有,大部分是无限制NODLL版,NODLL版本MT1420升级,大多数不可用!这些EA来源为国外花钱买过来的 如有需要,请联系站长! “EA测评”板块资源全部现有,看见不错的,可以联系站长,看EA在确定是否收费。 “无限制EA”板块,大部分免费,下载文件全部存在,都可以免费下载。 站长硬盘EA太多,因大部分时间做交易,做风控,没太多时间更新下载地址,请谅解! 需要更新下载文件,请联系站长微信!国外朋友请联系Telegram。  |
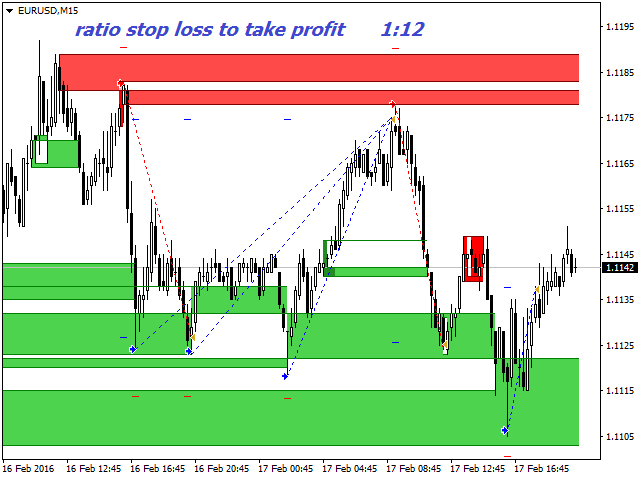
Let us analyze what supply and demand are, and how relevant the expression “market memory” is. The screenshots show the operation of the SupDem-Pro custom indicator, it is the improved version of my previously created Shved Supply and Demand indicator. In order to create it, I gave up trading for almost 3 years and studied a lot of literature, I have not traded during this time, but only analyzed the behavior of the price in different situations. It took me quite a long time to correctly formulate the task to the programmer. The indicator looks for zones which have an imbalance between supply and demand (buyers and sellers) and displays them on the charts for any instruments and timeframes. Red zones – supply zones, which are dominated by sellers. Green zones – demand zones dominated by buyers.
Eur/Usd H4 chart. The circle shows the formation of the supply and demand zones. The experienced traders, who intend to sell, are more likely to be at point 1, as they know that the chances of price falling are above 50%. This is the first test of the supply zone and sellers win over the annoying buyers. But buyers, with enough courage, managed to stop them at point 2.
At point 3 the sellers are still in the lead, but suppressing the buyers becomes harder and harder. This is the second zone test: the price moved even higher from the previous High of the point 1. Point 4 – test of the zone. At point 5 there was a war between the buyers and sellers, which lasted the whole day, each side fought to the last, but still at the end of the day the buyers won and started pushing the price higher and higher with almost no rollback.
However, sellers prepared for the next meeting at point 6 and were ready, the buyers had little chance to take them by storm. At points 7,8,9,10 it is shown how the price reacts to the supply and demand zones. At points 11, 12, 13, the price approaches the demand zone on the daily chart and gradually slows down. At point 14 it comes up close to the demand zone, on the daily chart the result is the movement of 450 points.
Let us analyze the price movement on the Eur/Usd H4 chart, as the А-А section but on a smaller H1 timeframe, in order to understand how the supply and demand zones work so to speak under the microscope. Our movement was on December 3rd.
Circles mark the formation of supply and demand zones. At points 1,2,3 it is clearly visible how the price tries to overcome the supply zones formed earlier. After the price could not overcome the supply zone at point 3, it pulls back to the closest newly formed supply zone. The reaction to these zones is the price behavior at points 4 and 5. After the correction the price manages to push through the supply zone at point 6. But it can not rise higher H4, as it is limited by the last supply zone it could not breach on H4. After the consolidation the price searches for the nearest demand zone, the reaction of points 7 and 8. On the way up there is another fresh supply zone – the reaction of points 9, 10, 11. After the failure the price starts to move to the nearest zones, points 12, 13, 14, 15.
Result: The supply and demand zones are always present everywhere, on any instrument and timeframe – these are the main laws of the market, the novice traders should start with this.
Important:
If you trade the supply and demand zones, you have to analyze the situation of the instrument on all available timeframes. Because the demand zone on one timeframe can be located, for example, inside the supply zone of the smaller or higher timeframe. So consider this – when testing in demo mode (only 1 timeframe) the zones will trigger and will be broken, this will always happen, it is just that one side (buyers or sellers) can not control the demand or supply zone forever, someone always wins.
This indicator serves for such analysis. It is able to display the supply and demand zones on any instrument and timeframe (M5,M15,M30,H1,H4,D1,W1). Also you must always remember that any, even the most powerful movement can be stopped by a zone on a smaller or higher timeframe.
Good luck in trading.
![图片[1]-Mql5官网 ShvedSupDem Pro Zone 外汇EA-EA侦探社 - 全球领先的MQL5官网外汇EA机器人MT4自动化交易EA资源免费分享网站](https://www.mql5.vip/wp-content/uploads/2024/05/20240521010338-664bf2eac1eb4.png)
![图片[2]-Mql5官网 ShvedSupDem Pro Zone 外汇EA-EA侦探社 - 全球领先的MQL5官网外汇EA机器人MT4自动化交易EA资源免费分享网站](https://www.mql5.vip/wp-content/uploads/2024/05/20240521010340-664bf2ec020d1.png)
![图片[3]-Mql5官网 ShvedSupDem Pro Zone 外汇EA-EA侦探社 - 全球领先的MQL5官网外汇EA机器人MT4自动化交易EA资源免费分享网站](https://www.mql5.vip/wp-content/uploads/2024/05/20240521010340-664bf2ecdcd09.png)
![图片[4]-Mql5官网 ShvedSupDem Pro Zone 外汇EA-EA侦探社 - 全球领先的MQL5官网外汇EA机器人MT4自动化交易EA资源免费分享网站](https://www.mql5.vip/wp-content/uploads/2024/05/20240521010341-664bf2ed6591a.png)
![图片[5]-Mql5官网 ShvedSupDem Pro Zone 外汇EA-EA侦探社 - 全球领先的MQL5官网外汇EA机器人MT4自动化交易EA资源免费分享网站](https://www.mql5.vip/wp-content/uploads/2024/05/20240521010341-664bf2ede59ae.png)
![图片[6]-Mql5官网 ShvedSupDem Pro Zone 外汇EA-EA侦探社 - 全球领先的MQL5官网外汇EA机器人MT4自动化交易EA资源免费分享网站](https://www.mql5.vip/wp-content/uploads/2024/05/20240521010342-664bf2ee77660.png)
![图片[7]-Mql5官网 ShvedSupDem Pro Zone 外汇EA-EA侦探社 - 全球领先的MQL5官网外汇EA机器人MT4自动化交易EA资源免费分享网站](https://www.mql5.vip/wp-content/uploads/2024/05/20240521010342-664bf2eef29b4.png)