
|
如果免费资源下载的文件为TXT文档 请联系站长更新!站长微信:Lv596999 Telegram:@eapoj “Mql5官网”板块的EA基本都有,大部分是无限制NODLL版,NODLL版本MT1420升级,大多数不可用!这些EA来源为国外花钱买过来的 如有需要,请联系站长! “EA测评”板块资源全部现有,看见不错的,可以联系站长,看EA在确定是否收费。 “无限制EA”板块,大部分免费,下载文件全部存在,都可以免费下载。 站长硬盘EA太多,因大部分时间做交易,做风控,没太多时间更新下载地址,请谅解! 需要更新下载文件,请联系站长微信!国外朋友请联系Telegram。  |
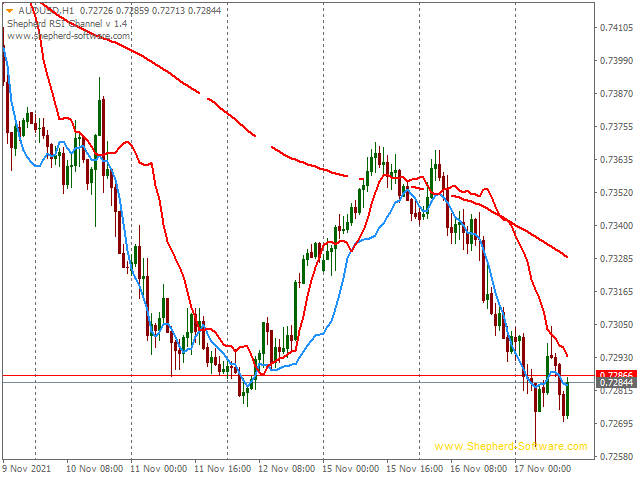
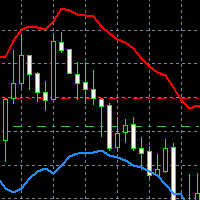
This indicator displays the channel of Relative Strength Index.
When you see that the price touches the red line and retreats from it many times, then you will know that the general trend is down.
When it retreats from the blue line many times, that means that the general trend is up.
This lines express the RSI values attributed to the price values on the main chart.
You can add this indicator to your strategy, it will help you.
This indicator will work best on 5 minutes and higher time frames.
Indicator properties:
- Use_System_Theme – You can choose from here the color setting to be add automatically .
![图片[1]-Mql5官网 Rsi Channel 外汇EA-EA侦探社 - 全球领先的MQL5官网外汇EA机器人MT4自动化交易EA资源免费分享网站](https://www.mql5.vip/wp-content/uploads/2024/05/20240521011951-664bf6b746555.png)