

|
如果免费资源下载的文件为TXT文档 请联系站长更新!站长微信:Lv596999 Telegram:@eapoj “Mql5官网”板块的EA基本都有,大部分是无限制NODLL版,NODLL版本MT1420升级,大多数不可用!这些EA来源为国外花钱买过来的 如有需要,请联系站长! “EA测评”板块资源全部现有,看见不错的,可以联系站长,看EA在确定是否收费。 “无限制EA”板块,大部分免费,下载文件全部存在,都可以免费下载。 站长硬盘EA太多,因大部分时间做交易,做风控,没太多时间更新下载地址,请谅解! 需要更新下载文件,请联系站长微信!国外朋友请联系Telegram。  |
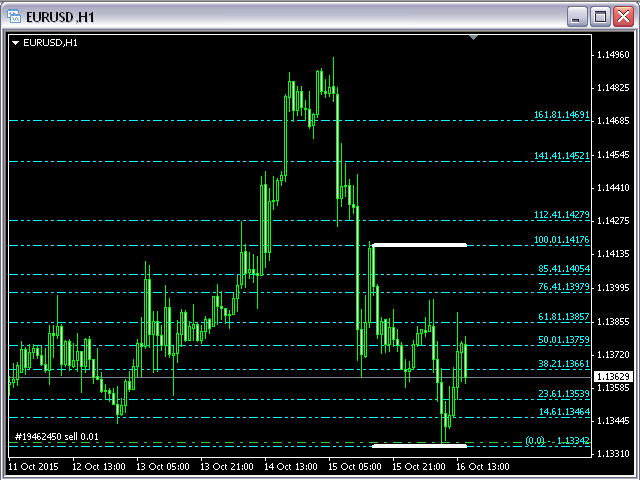
This indicator will draw Support and Resistance lines calculated on the nBars distance.
The Fibonacci lines will appear between those 2 lines and 3 levels above or under 100%.
You may change the value of each level and hide one line inside 0-100% range and all levels above or under 100%.
Input Parameters:
- nBars = 24; – amount of bars where the calculation of Support and Resistance will be done.
- Fibo = true; if false then only Support and Resistance will be shown.
- Level_1 = true; – display of the Fibonacci level.
- Fibo_Level_1 = 0.146; – the Fibonacci level value.
- …
- FiboColorUp = Aqua;
- FiboColorDn = Orange;
![图片[1]-Mql5官网 Fibonacci Support Resistance with any Values MT4 外汇EA-EA侦探社 - 全球领先的MQL5官网外汇EA机器人MT4自动化交易EA资源免费分享网站](https://www.mql5.vip/wp-content/uploads/2024/05/20240521013544-664bfa7025d4e.png)
![图片[2]-Mql5官网 Fibonacci Support Resistance with any Values MT4 外汇EA-EA侦探社 - 全球领先的MQL5官网外汇EA机器人MT4自动化交易EA资源免费分享网站](https://www.mql5.vip/wp-content/uploads/2024/05/20240521013546-664bfa723daa5.png)
![图片[3]-Mql5官网 Fibonacci Support Resistance with any Values MT4 外汇EA-EA侦探社 - 全球领先的MQL5官网外汇EA机器人MT4自动化交易EA资源免费分享网站](https://www.mql5.vip/wp-content/uploads/2024/05/20240521013548-664bfa7438460.png)
![图片[4]-Mql5官网 Fibonacci Support Resistance with any Values MT4 外汇EA-EA侦探社 - 全球领先的MQL5官网外汇EA机器人MT4自动化交易EA资源免费分享网站](https://www.mql5.vip/wp-content/uploads/2024/05/20240521013549-664bfa754938e.png)
![图片[5]-Mql5官网 Fibonacci Support Resistance with any Values MT4 外汇EA-EA侦探社 - 全球领先的MQL5官网外汇EA机器人MT4自动化交易EA资源免费分享网站](https://www.mql5.vip/wp-content/uploads/2024/05/20240521013549-664bfa75e25a4.png)
![图片[6]-Mql5官网 Fibonacci Support Resistance with any Values MT4 外汇EA-EA侦探社 - 全球领先的MQL5官网外汇EA机器人MT4自动化交易EA资源免费分享网站](https://www.mql5.vip/wp-content/uploads/2024/05/20240521013550-664bfa7680723.png)
![图片[7]-Mql5官网 Fibonacci Support Resistance with any Values MT4 外汇EA-EA侦探社 - 全球领先的MQL5官网外汇EA机器人MT4自动化交易EA资源免费分享网站](https://www.mql5.vip/wp-content/uploads/2024/05/20240521013551-664bfa7731846.png)
© 版权声明
文章版权归作者所有,未经允许请勿转载。
THE END


