
|
如果免费资源下载的文件为TXT文档 请联系站长更新!站长微信:Lv596999 Telegram:@eapoj “Mql5官网”板块的EA基本都有,大部分是无限制NODLL版,NODLL版本MT1420升级,大多数不可用!这些EA来源为国外花钱买过来的 如有需要,请联系站长! “EA测评”板块资源全部现有,看见不错的,可以联系站长,看EA在确定是否收费。 “无限制EA”板块,大部分免费,下载文件全部存在,都可以免费下载。 站长硬盘EA太多,因大部分时间做交易,做风控,没太多时间更新下载地址,请谅解! 需要更新下载文件,请联系站长微信!国外朋友请联系Telegram。  |
This indicator builds so called “random walk” bands: on every bar it finds maximal or average distance between current price and multiple expanding parabolic curves starting at predefined number of bars in the past. If you like Bollinger bands or Envelopes you may find this indicator useful as well.
As you may know, price movements are very similar to random walk time series (specifically, Gaussian random walk), yet they do effectively break the hypothesis of randomness. One of the features of the Gaussian random walk time series is that its translation distance after n steps (bars) is proportional to square root of n within a factor of some constant (deviation). Visually this can be represented as a parabolic curve originating at a specific bar and widening in direction of the future. As price fluctuates inside the parabola, it confirms the random walk hypothesis, thus such situation may be considered as random process without preferred direction, that is “flat”. Once price breaks out the parabola, some deterministic process (“trend”) comes into play.
The indicator calculates positions for upper and lower parabolic lines starting at each of Depth past bars, and then selects either most distant or average value (depending from Average setting) for drawing the bands.
Parameters
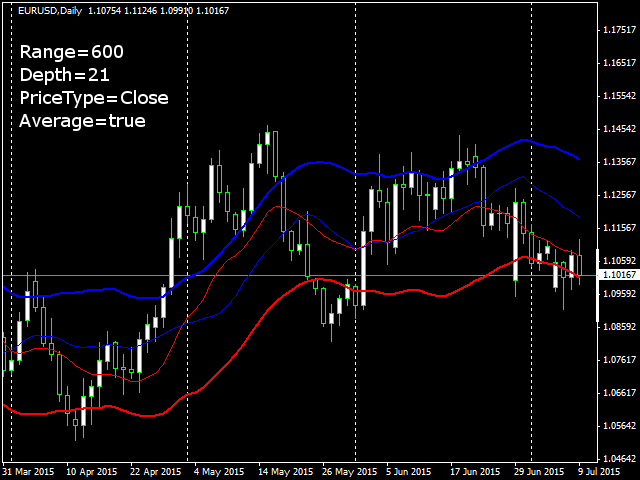
- Range – range of points to use as deviation; by default – 0, which means automatic calculation on one day-length number of bars for current timeframe; if calculation produces 1 or less bars (for D1 and higher), then Range is determined on last Depth bars;
- Depth – number of past bars to construct parabolas; by default – 11;
- PriceType – price type to use in calculations; by default – PRICE_CLOSE;
- Average – an option to choose one of two modes; false means to find maximal value among Depth results, true means average of Depth results; by default – false;
According to parameters used, one may trade the bands using break through or rebound strategies.
The indicator shows two thick lines as the bands (upper is blue and lower is red), and two thin lines. In the average mode the thin lines denote standard deviation from bands, and otherwise they show minimal maximums and maximal minimums of parabolic values.
While trading break through strategy the thin lines are stoploss positions, and while trading rebound they are first (partial) takeprofit position (mostly in the average mode).
![图片[1]-Mql5官网 RandomWalk 外汇EA-EA侦探社 - 全球领先的MQL5官网外汇EA机器人MT4自动化交易EA资源免费分享网站](https://www.mql5.vip/wp-content/uploads/2024/05/20240521015342-664bfea62c2b9.png)
![图片[2]-Mql5官网 RandomWalk 外汇EA-EA侦探社 - 全球领先的MQL5官网外汇EA机器人MT4自动化交易EA资源免费分享网站](https://www.mql5.vip/wp-content/uploads/2024/05/20240521015343-664bfea702986.png)
![图片[3]-Mql5官网 RandomWalk 外汇EA-EA侦探社 - 全球领先的MQL5官网外汇EA机器人MT4自动化交易EA资源免费分享网站](https://www.mql5.vip/wp-content/uploads/2024/05/20240521015344-664bfea84c085.png)
![图片[4]-Mql5官网 RandomWalk 外汇EA-EA侦探社 - 全球领先的MQL5官网外汇EA机器人MT4自动化交易EA资源免费分享网站](https://www.mql5.vip/wp-content/uploads/2024/05/20240521015345-664bfea9d30b1.png)