|
如果免费资源下载的文件为TXT文档 请联系站长更新!站长微信:Lv596999 Telegram:@eapoj “Mql5官网”板块的EA基本都有,大部分是无限制NODLL版,NODLL版本MT1420升级,大多数不可用!这些EA来源为国外花钱买过来的 如有需要,请联系站长! “EA测评”板块资源全部现有,看见不错的,可以联系站长,看EA在确定是否收费。 “无限制EA”板块,大部分免费,下载文件全部存在,都可以免费下载。 站长硬盘EA太多,因大部分时间做交易,做风控,没太多时间更新下载地址,请谅解! 需要更新下载文件,请联系站长微信!国外朋友请联系Telegram。  |
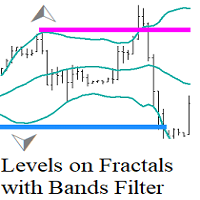
The Nash Equilibrium MT4 draws the channel as a Trend and as Envelopes or Bands.
You may use these white lines as levels for overbought and oversold conditions.
Inside Bands, this indicator draws dot white line as a median line
between the two bands and Aqua or Orange line and you may use this
change of colors as moment to enter the market.
Parameters
- nPeriod = 13 – number of Bars for indicator’s calculation.
- nBars = 500 – number of Bars where the indicator is to be shown.
Attention: This indicator works from M1 to D1 TFs.
![图片[1]-Mql5官网 Nash Equilibrium MT4 外汇EA-EA侦探社 - 全球领先的MQL5官网外汇EA机器人MT4自动化交易EA资源免费分享网站](https://www.mql5.vip/wp-content/uploads/2024/05/20240521020235-664c00bbe79d3.png)
![图片[2]-Mql5官网 Nash Equilibrium MT4 外汇EA-EA侦探社 - 全球领先的MQL5官网外汇EA机器人MT4自动化交易EA资源免费分享网站](https://www.mql5.vip/wp-content/uploads/2024/05/20240521020236-664c00bc98b8d.png)
![图片[3]-Mql5官网 Nash Equilibrium MT4 外汇EA-EA侦探社 - 全球领先的MQL5官网外汇EA机器人MT4自动化交易EA资源免费分享网站](https://www.mql5.vip/wp-content/uploads/2024/05/20240521020237-664c00bd2e031.png)
![图片[4]-Mql5官网 Nash Equilibrium MT4 外汇EA-EA侦探社 - 全球领先的MQL5官网外汇EA机器人MT4自动化交易EA资源免费分享网站](https://www.mql5.vip/wp-content/uploads/2024/05/20240521020237-664c00bda384e.png)
![图片[5]-Mql5官网 Nash Equilibrium MT4 外汇EA-EA侦探社 - 全球领先的MQL5官网外汇EA机器人MT4自动化交易EA资源免费分享网站](https://www.mql5.vip/wp-content/uploads/2024/05/20240521020238-664c00be6bd9b.png)
![图片[6]-Mql5官网 Nash Equilibrium MT4 外汇EA-EA侦探社 - 全球领先的MQL5官网外汇EA机器人MT4自动化交易EA资源免费分享网站](https://www.mql5.vip/wp-content/uploads/2024/05/20240521020240-664c00c001f03.png)
![图片[7]-Mql5官网 Nash Equilibrium MT4 外汇EA-EA侦探社 - 全球领先的MQL5官网外汇EA机器人MT4自动化交易EA资源免费分享网站](https://www.mql5.vip/wp-content/uploads/2024/05/20240521020242-664c00c248627.png)
![图片[8]-Mql5官网 Nash Equilibrium MT4 外汇EA-EA侦探社 - 全球领先的MQL5官网外汇EA机器人MT4自动化交易EA资源免费分享网站](https://www.mql5.vip/wp-content/uploads/2024/05/20240521020244-664c00c4df494.png)
![图片[9]-Mql5官网 Nash Equilibrium MT4 外汇EA-EA侦探社 - 全球领先的MQL5官网外汇EA机器人MT4自动化交易EA资源免费分享网站](https://www.mql5.vip/wp-content/uploads/2024/05/20240521020246-664c00c682093.png)

© 版权声明
文章版权归作者所有,未经允许请勿转载。
THE END