
|
如果免费资源下载的文件为TXT文档 请联系站长更新!站长微信:Lv596999 Telegram:@eapoj “Mql5官网”板块的EA基本都有,大部分是无限制NODLL版,NODLL版本MT1420升级,大多数不可用!这些EA来源为国外花钱买过来的 如有需要,请联系站长! “EA测评”板块资源全部现有,看见不错的,可以联系站长,看EA在确定是否收费。 “无限制EA”板块,大部分免费,下载文件全部存在,都可以免费下载。 站长硬盘EA太多,因大部分时间做交易,做风控,没太多时间更新下载地址,请谅解! 需要更新下载文件,请联系站长微信!国外朋友请联系Telegram。  |
PivotHighLow.
Universal business tool from professional traders that helps to visualize interest market situations. It previews markets using a price action and sentiment in the market. Tool is necessary to understand the market situation and the anticipation of further movement. Finally, you will see how traders estimate the market.
With this tool, you will see important supports and resistances. It shows you the entry of big players on the market.
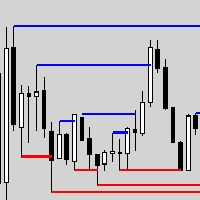
The indicator works on all timeframes. You are not limited by use of different timeframes, the indicator is able to adapt. On the screenshots, you can see different views of the PivotHighLow indicator and entrances to the market. The indicator contains basic settings. Please keep in mind that the use of more bars for calculation may lead to the program slowdown.
Finally, you will see the entry of big players in the market!
It is not possible to manually draw all PivotHighLow on all markets you trade!
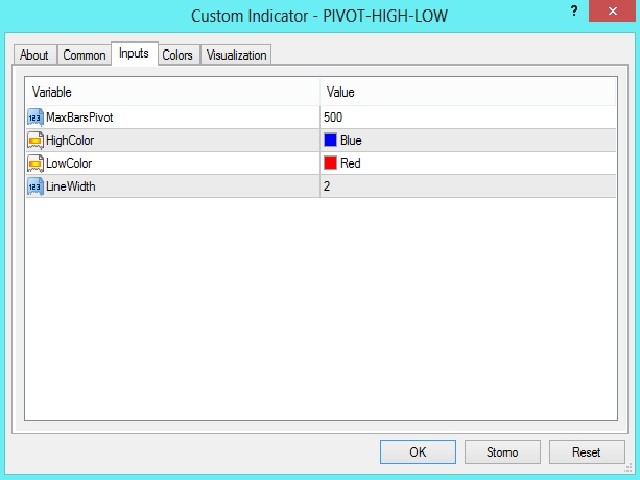
Settings:
- MaxBarsPivot=500 – indicator shows PivotHigh/Low 500 bars back
- HighColor – color of high Pivot
- LowColor – color of low Pivot
- LineWidth=2 – line width
![图片[1]-Mql5官网 PivotHighLow 外汇EA-EA侦探社 - 全球领先的MQL5官网外汇EA机器人MT4自动化交易EA资源免费分享网站](https://www.mql5.vip/wp-content/uploads/2024/05/20240521021430-664c0386b6e39.jpg)
![图片[2]-Mql5官网 PivotHighLow 外汇EA-EA侦探社 - 全球领先的MQL5官网外汇EA机器人MT4自动化交易EA资源免费分享网站](https://www.mql5.vip/wp-content/uploads/2024/05/20240521021431-664c038798838.jpg)