
|
如果免费资源下载的文件为TXT文档 请联系站长更新!站长微信:Lv596999 Telegram:@eapoj “Mql5官网”板块的EA基本都有,大部分是无限制NODLL版,NODLL版本MT1420升级,大多数不可用!这些EA来源为国外花钱买过来的 如有需要,请联系站长! “EA测评”板块资源全部现有,看见不错的,可以联系站长,看EA在确定是否收费。 “无限制EA”板块,大部分免费,下载文件全部存在,都可以免费下载。 站长硬盘EA太多,因大部分时间做交易,做风控,没太多时间更新下载地址,请谅解! 需要更新下载文件,请联系站长微信!国外朋友请联系Telegram。  |
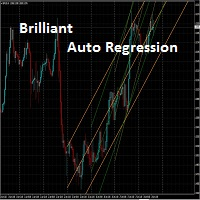
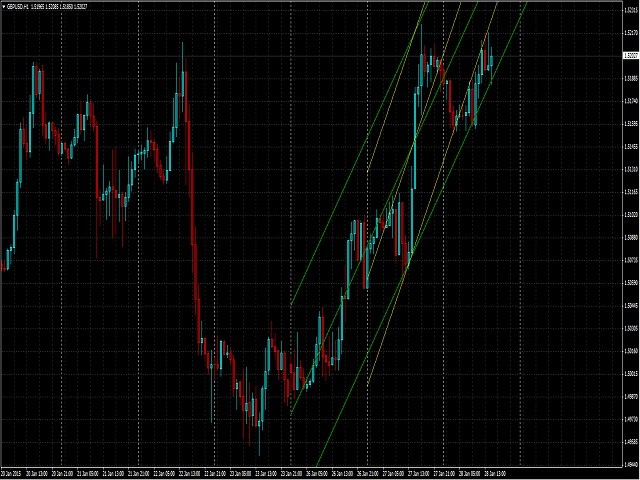
The indicator automatically draws up to five different regression channels.
The product draws the channels for the previous major periods.
For example:
| Indicator Chart | Drawing Period |
|---|---|
| M1 | D1 |
| M5 | D1 |
| M15 | D1 |
| M30 | D1 |
| H1 | D1 |
| H4 | W1 |
It updates itself at the beginning of the major period (ex.: D1 or W1).
The periods are in the major period domain.
For example: if the indicator is put on H1 chart, the period of 1 means 1 day on the chart.
![图片[1]-Mql5官网 Brilliant Auto Regression Channels 外汇EA-EA侦探社 - 全球领先的MQL5官网外汇EA机器人MT4自动化交易EA资源免费分享网站](https://www.mql5.vip/wp-content/uploads/2024/05/20240521022524-664c0614a030e.jpg)
© 版权声明
文章版权归作者所有,未经允许请勿转载。
THE END


