
|
如果免费资源下载的文件为TXT文档 请联系站长更新!站长微信:Lv596999 Telegram:@eapoj “Mql5官网”板块的EA基本都有,大部分是无限制NODLL版,NODLL版本MT1420升级,大多数不可用!这些EA来源为国外花钱买过来的 如有需要,请联系站长! “EA测评”板块资源全部现有,看见不错的,可以联系站长,看EA在确定是否收费。 “无限制EA”板块,大部分免费,下载文件全部存在,都可以免费下载。 站长硬盘EA太多,因大部分时间做交易,做风控,没太多时间更新下载地址,请谅解! 需要更新下载文件,请联系站长微信!国外朋友请联系Telegram。  |
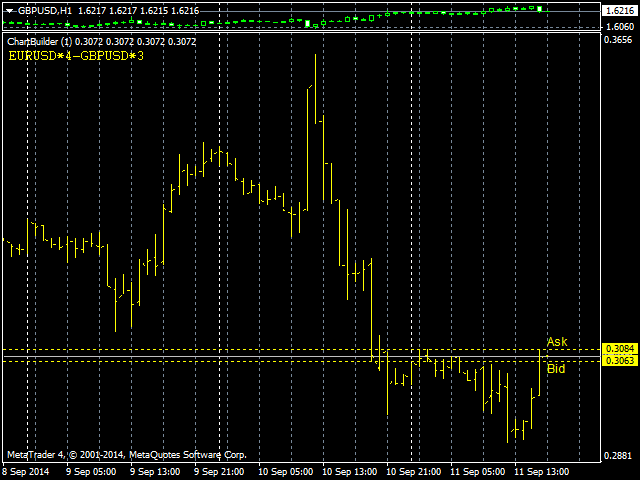
The indicator is designed for easy construction of synthetic charts based on data of various financial instruments. It will be useful both arbitrage and pair trading, as well as for analysis purposes. Its main advantage is simplicity and clarity. Each chart is given as a common mathematical formula. For example, if you want to plot the spread (difference) between EURUSD and GBPUSD with coefficients 4 and 3, then set the following formula:
EURUSD * 4 – GBPUSD * 3
The resulting chart is shown in the screenshot. But this is one of the simplest examples. Indicator allows you to draw charts of much more complex and interesting things. It also can monitor certain price levels set by the user, and generate a signal when price reaches the levels.
Please find the full description of the indicator on the Comments tab (Russian).
Indicator Parameters
- Formula1
- Formula2
- …
- Formula12 – set formulas for each chart
- Precision – indicator precision after a decimal point.
- TimeShift_minutes – time shift for all charts relative to the price scale (in minutes)
- TimeSnap_Mode – time snapping resulting values to the displayed bars of the indicator. It can be set in “bars” or in “minutes“.
- TimeSnap_Size – maximum snapping size. If the time lag between the calculated bar and the actual bar exceeds this size, the bar will not be displayed on the screen. If set to -1, then there are no snapping limits.
- Draw Mode – chart drawing mode:
- LINE
- BARS
- SECTION (sections between non-empty values)
- HISTOGRAM
- POINTS
- AUTO (selected automatically in accordance with the selected display mode in the main window)
- Interpolation Timeframe – the timeframe for the interpolation of intra-bar values when building synthetic bars. Default is M1
- Auto Scale – chart auto scale mode. Specify the number of the main chart; all other charts will be adjusted to the height of this chart.
- Show Labels – choose location of names of formulas in the chart window (left or right)
- Show Bid/Ask – show synthetic Bid/Ask for each chart
- Signal_ChartNumber chart number for which signal values and signal lines are used.
- Signal_HighValue – the upper signal value, after reaching which a signal will be generated
- Signal_LowValue – the lower signal value
- Signal_HighLine – the name of the upper signal line, after reaching which a signal will be generated
- Signal_LowLine – the name of the lower signal line
- Signal_CrossCharts – chart numbers (separated by commas or spaces), when they are crossed a signal will be generated.
- Signal_Pause – a pause between repetitions of the same signal (in seconds)
- Save_ChartNumber – the number of the chart, the values of which should be saved to a text file.
- Save_FileName – the name of the text file to save chart values
- Save_FileDelimiter – text separator used in the file. If nothing is specified, the tab character will be used.