|
如果免费资源下载的文件为TXT文档 请联系站长更新!站长微信:Lv596999 Telegram:@eapoj “Mql5官网”板块的EA基本都有,大部分是无限制NODLL版,NODLL版本MT1420升级,大多数不可用!这些EA来源为国外花钱买过来的 如有需要,请联系站长! “EA测评”板块资源全部现有,看见不错的,可以联系站长,看EA在确定是否收费。 “无限制EA”板块,大部分免费,下载文件全部存在,都可以免费下载。 站长硬盘EA太多,因大部分时间做交易,做风控,没太多时间更新下载地址,请谅解! 需要更新下载文件,请联系站长微信!国外朋友请联系Telegram。  |
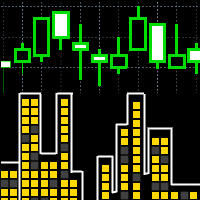
This indicator is designed for M1 time-frame and shows:
- Sum of ticks when the price goes up (color Green -The major component of a candlestick = the body).
- Sum of points when the price goes up (color Green -The extension lines at the top of the candle).
- Sum of points when the price goes down (color Red -The major component of a candlestick = the body).
- Sum of points when the price goes down (color Red -The extension lines at the lower end of the candle).
Keep in mind that Sum of Points will be greater or equal to Sum of Ticks.
![图片[1]-Mql5官网 Ticks and Points Candles MT4 外汇EA-EA侦探社 - 全球领先的MQL5官网外汇EA机器人MT4自动化交易EA资源免费分享网站](https://www.mql5.vip/wp-content/uploads/2024/05/20240521025742-664c0da6c692f.png)
![图片[2]-Mql5官网 Ticks and Points Candles MT4 外汇EA-EA侦探社 - 全球领先的MQL5官网外汇EA机器人MT4自动化交易EA资源免费分享网站](https://www.mql5.vip/wp-content/uploads/2024/05/20240521025743-664c0da7e5a9a.png)

© 版权声明
文章版权归作者所有,未经允许请勿转载。
THE END