
|
如果免费资源下载的文件为TXT文档 请联系站长更新!站长微信:Lv596999 Telegram:@eapoj “Mql5官网”板块的EA基本都有,大部分是无限制NODLL版,NODLL版本MT1420升级,大多数不可用!这些EA来源为国外花钱买过来的 如有需要,请联系站长! “EA测评”板块资源全部现有,看见不错的,可以联系站长,看EA在确定是否收费。 “无限制EA”板块,大部分免费,下载文件全部存在,都可以免费下载。 站长硬盘EA太多,因大部分时间做交易,做风控,没太多时间更新下载地址,请谅解! 需要更新下载文件,请联系站长微信!国外朋友请联系Telegram。  |
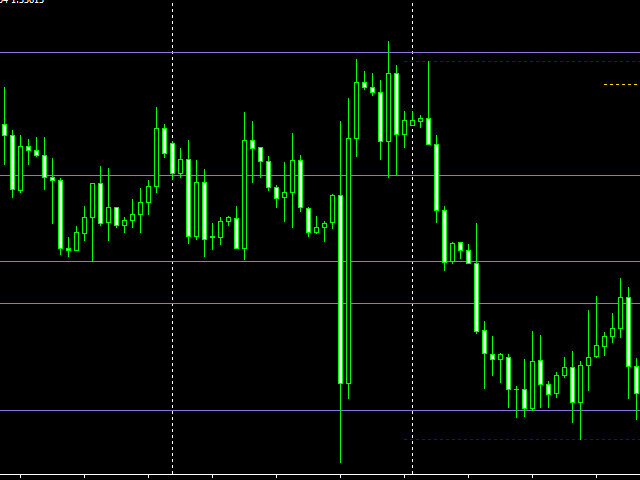
The indicator shows support and resistance levels on the chart.
Features:
- It shows support and resistance levels for the last 12 months.
- Shows the High and the Low of the last week.
- Shows the “MA 200” value.
- Shows gaps with a preset filter.
The indicator settings:
- ShowMA200 – show/hide the MA 200 value.
- ColorMA200 – the MA 200 line color.
- LineStyleMA200 – MA 200 line style.
- LineWidthMA200 – MA 200 line width.
- ShowMonth – show/hide support/resistance levels.
- ColorMonthL – line color.
- LineStyleMonthL – line style.
- LineWidthMonthL – line width.
- ShowWeek – show/hide last week high/low levels.
- ColorWeekL – line color.
- LineStyleWeekL – line style.
- LineWidthWeekL – line width.
- ShowGAP – show/hide gaps.
- MinIntGap – minimum price gap in points to show.
- ColorRect – line color.
- ShowText – show/hide level descriptions.
- ColorText – text color.
- TextFontSize – text font size.
![图片[1]-Mql5官网 DI Support resistance 外汇EA-EA侦探社 - 全球领先的MQL5官网外汇EA机器人MT4自动化交易EA资源免费分享网站](https://www.mql5.vip/wp-content/uploads/2024/05/20240521030755-664c100b8e57e.jpg)
![图片[2]-Mql5官网 DI Support resistance 外汇EA-EA侦探社 - 全球领先的MQL5官网外汇EA机器人MT4自动化交易EA资源免费分享网站](https://www.mql5.vip/wp-content/uploads/2024/05/20240521030758-664c100e1edb8.jpg)
![图片[3]-Mql5官网 DI Support resistance 外汇EA-EA侦探社 - 全球领先的MQL5官网外汇EA机器人MT4自动化交易EA资源免费分享网站](https://www.mql5.vip/wp-content/uploads/2024/05/20240521030800-664c10108538e.jpg)
![图片[4]-Mql5官网 DI Support resistance 外汇EA-EA侦探社 - 全球领先的MQL5官网外汇EA机器人MT4自动化交易EA资源免费分享网站](https://www.mql5.vip/wp-content/uploads/2024/05/20240521030803-664c101306798.jpg)
![图片[5]-Mql5官网 DI Support resistance 外汇EA-EA侦探社 - 全球领先的MQL5官网外汇EA机器人MT4自动化交易EA资源免费分享网站](https://www.mql5.vip/wp-content/uploads/2024/05/20240521030806-664c1016833c0.jpg)
© 版权声明
文章版权归作者所有,未经允许请勿转载。
THE END