
|
如果免费资源下载的文件为TXT文档 请联系站长更新!站长微信:Lv596999 Telegram:@eapoj “Mql5官网”板块的EA基本都有,大部分是无限制NODLL版,NODLL版本MT1420升级,大多数不可用!这些EA来源为国外花钱买过来的 如有需要,请联系站长! “EA测评”板块资源全部现有,看见不错的,可以联系站长,看EA在确定是否收费。 “无限制EA”板块,大部分免费,下载文件全部存在,都可以免费下载。 站长硬盘EA太多,因大部分时间做交易,做风控,没太多时间更新下载地址,请谅解! 需要更新下载文件,请联系站长微信!国外朋友请联系Telegram。  |
The indicator provides a statistic histogram of estimated price movements for intraday bars. It builds a histogram of average price movements for every intraday bar in history, separately for each day of week. Bars with movements above standard deviation or with higher percentage of buys than sells, or vice versa, can be used as direct trading signals.
The indicator looks up current symbol history and sums up returns on every single intraday bar on a specific day of week. For example, if current chart is H1 there are 5 internal cells for counting price changes for the bar 15:00 on Monday, Tuesday, Wednesday, Thursday, and Friday. And there are 24 such 5-cell vectors for every hourly bar. Also for every specific intraday bar, on each day of week, it counts number of times the bar moved up or down.
The analysis of complete set of returns gives an average (expectation) of price movement for a single bar (this is a value near 0, but can hold a small bias: supertrend) and a deviation of the movements. Then it’s easy to detect those cells, which represent bars with movements larger than the average plus/minus the deviation. This is a statistically grounded estimation of which bars, on which day of week have a tendency to move bullish or bearish.
Alternatively, the indicator allows for counting number of bullish and bearish instances of a specific intraday bar, and detecting bars where buys or sells occurred significantly more frequent than opposite direction.
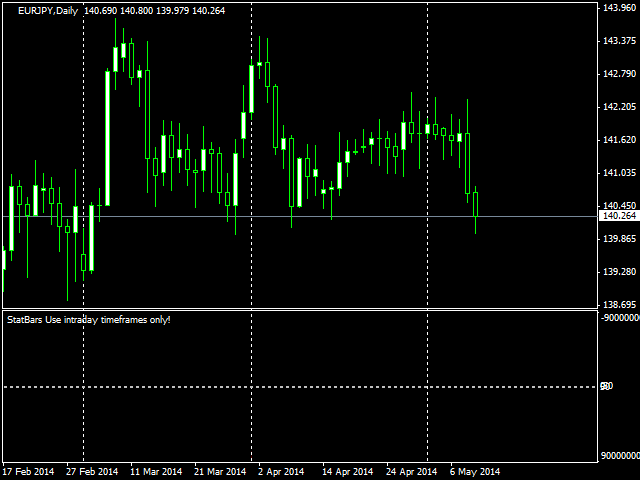
The indicator should be placed on intraday timeframes only – D1 and up are incorrect. Also, please, note that timeframes smaller than M15 are not so useful, because a single bar becomes too small. Recommended timeframes are M15, M30, H1, H4.
When placed on a chart, indicator highlights 2 ranges of bars: one at the end of existing history (“backtest”), and one in the future (“forward”). Both ranges contain number of bars equal to a full day, for example, 24 bars for H1 timeframe. For the backtest range indicator calculates virtual profit that could happen if one traded by its signals, and displays the result in the indicator title. For example, on the first screenshot below this message reads: StatBarsPoints: 394 pts in 12 single-bar-orders. Indeed the backtest shows 12 bars (highlighted in yellow bold) with historical size exceeding detected deviation, and even though not all of them matched actual price movement, overall return is positive. Please, note that the virtual profit is counted without spreads.
The forward range is shown as a prediction of what can happen in near future. You should possibly be prepared to trade on most prominent forthcoming bar signals.
Parameters:
- DayOffset – number of “day”, where analysis of the history ends; by default – 0, which means that the “backtest” is at the end of existing history; values 1 and above allows you to move “future” back, and to test virtual trading on other periods in the history; the “day” here means a number of bars forming a full day, not a calendar day; for example, if the latest bar is 15:00, than setting this parameter to 1 will move “backtest” and “forward” divider to 15:00 bar of the previous day;
- Threshold – specifies a threshold to detect signal bars; by default – 1; the meaning of the threshold depends from Percentage parameter, that is from operating mode of the indicator; when Percentage is false, Threshold is a fraction of deviation; when Percentage is true, Threshold is a percent (1.0 = 100%);
- Percentage – flag to choose an operating mode of the indicator: false – mode of calculating points; true – mode of calculating percents; by default – false (more reliable);
By default, indicator analyses bar returns in points. For example, if the average on the whole history is +1 point per bar (5-digits, AUDJPY) and the deviation is 15 points, then with the threshold equal to 1, indicator will signal bars with expected returns 16 (1+15) and more points in buys or 14 (1-15) and more points in sells. If the threshold is set to 2, then the levels will be 31 (1+15*2) and 29 (1-15*2).
When indicator calculates percentage of buys and sells for every intraday bar, threshold should be somewhat lower 1.0, because 1.0 = 100% and there is no such a persistent bar ever (if it existed, it would be a “golden” bar bringing a profit internally), that is the threshold will be unreachable. For example, setting the threshold to 0.7 means that indicator will signal bars, on which 70% or more of movements was either buy or sell, that is the bars with a noticeable bias.
![图片[1]-Mql5官网 StatBars 外汇EA-EA侦探社 - 全球领先的MQL5官网外汇EA机器人MT4自动化交易EA资源免费分享网站](https://www.mql5.vip/wp-content/uploads/2024/05/20240521031914-664c12b241eb0.gif)
![图片[2]-Mql5官网 StatBars 外汇EA-EA侦探社 - 全球领先的MQL5官网外汇EA机器人MT4自动化交易EA资源免费分享网站](https://www.mql5.vip/wp-content/uploads/2024/05/20240521031918-664c12b6eba2a.gif)
![图片[3]-Mql5官网 StatBars 外汇EA-EA侦探社 - 全球领先的MQL5官网外汇EA机器人MT4自动化交易EA资源免费分享网站](https://www.mql5.vip/wp-content/uploads/2024/05/20240521031922-664c12ba90a1c.gif)
![图片[4]-Mql5官网 StatBars 外汇EA-EA侦探社 - 全球领先的MQL5官网外汇EA机器人MT4自动化交易EA资源免费分享网站](https://www.mql5.vip/wp-content/uploads/2024/05/20240521031925-664c12bd2380b.gif)