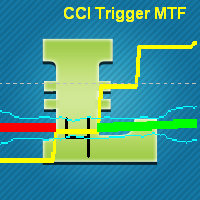
This indicator is using 2 classical indicators: Commodity Channel Index from the higher TF (which you may change using input parameter TimeFrame) and Average True Range from the current TF.
The Green ribbon indicates the upper trend and the Red ribbon indicates the down trend.
Buy when the Yellow line crosses the Upper bound (Aqua line).
Sell when the Yellow line crossover the Lower bound (Aqua line).

© 版权声明
文章版权归作者所有,未经允许请勿转载。
THE END


