
|
如果免费资源下载的文件为TXT文档 请联系站长更新!站长微信:Lv596999 Telegram:@eapoj “Mql5官网”板块的EA基本都有,大部分是无限制NODLL版,NODLL版本MT1420升级,大多数不可用!这些EA来源为国外花钱买过来的 如有需要,请联系站长! “EA测评”板块资源全部现有,看见不错的,可以联系站长,看EA在确定是否收费。 “无限制EA”板块,大部分免费,下载文件全部存在,都可以免费下载。 站长硬盘EA太多,因大部分时间做交易,做风控,没太多时间更新下载地址,请谅解! 需要更新下载文件,请联系站长微信!国外朋友请联系Telegram。  |
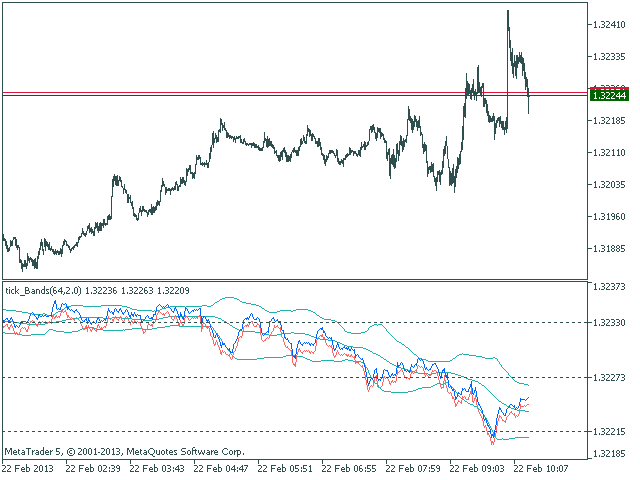
The Bollinger Bands indicator drawn using a tick chart.
After launching it, wait for enough ticks to come.
Parameters:
- Period – period of averaging.
- Deviation – deviation from the main line.
- Price levels count – number of displayed price levels (no levels are displayed if set to 0).
- Bar under calculation – number of bars on the chart for the indicator calculation.
Buffer indexes: 0 – BASE_LINE, 1 – UPPER_BAND, 2 – LOWER_BAND, 3 – BID, 4 – ASK.
© 版权声明
文章版权归作者所有,未经允许请勿转载。
THE END