
|
如果免费资源下载的文件为TXT文档 请联系站长更新!站长微信:Lv596999 Telegram:@eapoj “Mql5官网”板块的EA基本都有,大部分是无限制NODLL版,NODLL版本MT1420升级,大多数不可用!这些EA来源为国外花钱买过来的 如有需要,请联系站长! “EA测评”板块资源全部现有,看见不错的,可以联系站长,看EA在确定是否收费。 “无限制EA”板块,大部分免费,下载文件全部存在,都可以免费下载。 站长硬盘EA太多,因大部分时间做交易,做风控,没太多时间更新下载地址,请谅解! 需要更新下载文件,请联系站长微信!国外朋友请联系Telegram。  |
What Is Moving Average Convergence Divergence (MACD)? Moving average convergence divergence (MACD) is a trend-following momentum indicator that shows the relationship between two moving averages of a security’s price. The MACD is calculated by subtracting the 26-period exponential moving average (EMA) from the 12-period EMA.
The result of that calculation is the MACD line. A nine-day EMA of the MACD called the “signal line,” is then plotted on top of the MACD line, which can function as a trigger for buy and sell signals. Traders may buy the security when the MACD crosses above its signal line and sell—or short—the security when the MACD crosses below the signal line. Moving average convergence divergence (MACD) indicators can be interpreted in several ways, but the more common methods are crossovers, divergences, and rapid rises/falls.
When the MACD forms highs or lows that diverge from the corresponding highs and lows on the price, it is called a divergence. A bullish divergence appears when the MACD forms two rising lows that correspond with two falling lows on the price. This is a valid bullish signal when the long-term trend is still positive.
Some traders will look for bullish divergences even when the long-term trend is negative because they can signal a change in the trend, although this technique is less reliable.
When the MACD forms a series of two falling highs that correspond with two rising highs on the price, a bearish divergence has been formed. A bearish divergence that appears during a long-term bearish trend is considered confirmation that the trend is likely to continue.
Some traders will watch for bearish divergences during long-term bullish trends because they can signal weakness in the trend. However, it is not as reliable as a bearish divergence during a bearish trend. ( Reference : Investopedia-MACD )
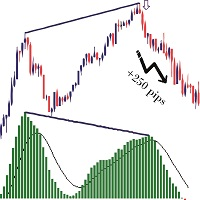
So this indicator help us to see this divergences and give you some alert when he detected a new one.
Indicator Parameters
MACD Settings: Fast EMA Period Slow EMA Period Signal SMA Period Apply to Positive MACD Color Negative MACD Color Signal Color
Divergence Settings: Show Bullish Divergence Use Bullish Divergence Alert Show Bearish Divergence Use Bearish Divergence Alert Candles To Look Back For Divergence
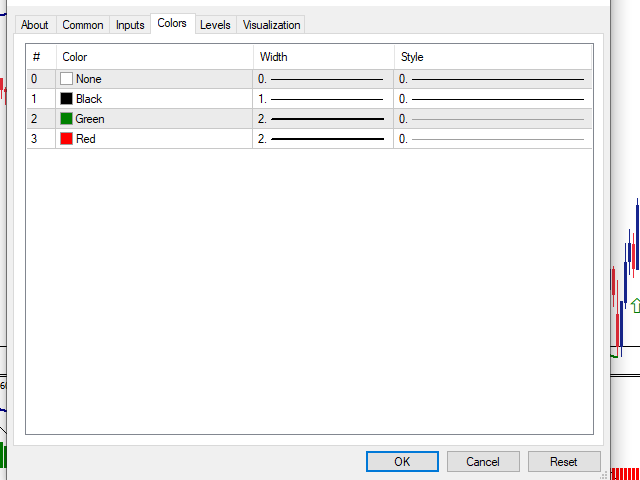
Drawing Settings: Bullish Divergence Line Color Bearish Divergence Line Color Lines & Arrow Thickness Lines & Arrow Style Object SELECTABLE Dimension Coefficient ( For The Arrow )
For Any Update Idea Please Contact Me here. ![图片[1]-MACD Divergence MALAK 1-EA侦探社 - 全球领先的MQL5官网外汇EA机器人MT4自动化交易EA资源免费分享网站](https://www.mql5.vip/wp-content/uploads/2024/04/20240427094803-662cc9d350372.png)
![图片[2]-MACD Divergence MALAK 1-EA侦探社 - 全球领先的MQL5官网外汇EA机器人MT4自动化交易EA资源免费分享网站](https://www.mql5.vip/wp-content/uploads/2024/04/20240427094803-662cc9d380140.png)
![图片[3]-MACD Divergence MALAK 1-EA侦探社 - 全球领先的MQL5官网外汇EA机器人MT4自动化交易EA资源免费分享网站](https://www.mql5.vip/wp-content/uploads/2024/04/20240427094803-662cc9d3b1fb5.png)
![图片[4]-MACD Divergence MALAK 1-EA侦探社 - 全球领先的MQL5官网外汇EA机器人MT4自动化交易EA资源免费分享网站](https://www.mql5.vip/wp-content/uploads/2024/04/20240427094804-662cc9d407607.png)
![图片[5]-MACD Divergence MALAK 1-EA侦探社 - 全球领先的MQL5官网外汇EA机器人MT4自动化交易EA资源免费分享网站](https://www.mql5.vip/wp-content/uploads/2024/04/20240427094804-662cc9d480f4c.png)