
|
如果免费资源下载的文件为TXT文档 请联系站长更新!站长微信:Lv596999 Telegram:@eapoj “Mql5官网”板块的EA基本都有,大部分是无限制NODLL版,NODLL版本MT1420升级,大多数不可用!这些EA来源为国外花钱买过来的 如有需要,请联系站长! “EA测评”板块资源全部现有,看见不错的,可以联系站长,看EA在确定是否收费。 “无限制EA”板块,大部分免费,下载文件全部存在,都可以免费下载。 站长硬盘EA太多,因大部分时间做交易,做风控,没太多时间更新下载地址,请谅解! 需要更新下载文件,请联系站长微信!国外朋友请联系Telegram。  |
Introduction to Sideways Market Analyzer
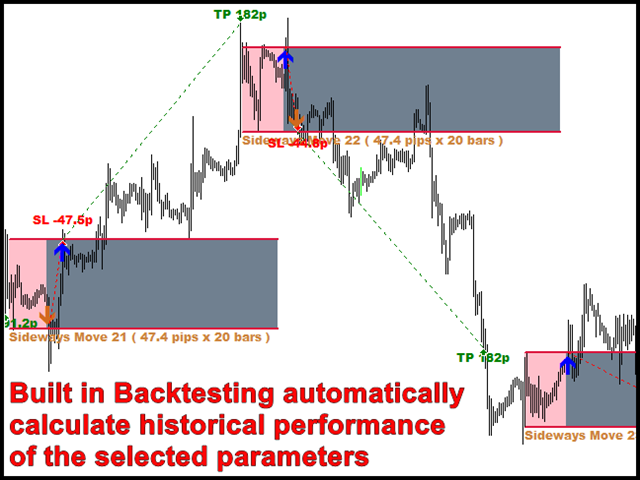
Notable period of Low volatility and non-trending movements in the financial market is considered as Sideways Market. Sooner or later, the low volatility will increase and the price will pick up a trend after Sideways Market. In terms of trading point of view, Sideways Market can serve as the very good entry timing for traders. Sideways Market is also quite often the representation of accumulation of large orders from big investors. Therefore, knowing the presence of Sideways Market can help you to decide good entry and exit timing.
Traditionally, the Average Directional Index (ADX) indicator or moving average of standard deviation indicators was used to roughly determine the presence of Sideways Market. However, both of the indicators are lagging with very low correlation with future price movement. They will not provide you clear idea on when the Sideways Market started and when it ends. Missing all these important information leaves traders with a very uncertain picture on the current market situation.
Here we have very accurate Sideways Market Analyzer inspired by the statistical theory. Indeed, this Sideways Market Statistical Analyzer can detect Sideways Market just like human eyes can do. In terms of trading signal, you open a buy order when the price hits the top of the Sideways and you open a sell order when the price hits the bottom of the detected Sideways Box. Sideway Market Analyzer provides you with a fixed stop loss and take profit levels. Sideways Market Statistical Analyzer works well for most of the currency pairs.
| Symbol | Cut Probability | Box Buffer Pips | Take Profit | Lot Multiplier | Total Net Pip gains (9 month) | Monthly Pip Gains |
|---|---|---|---|---|---|---|
| AUDCAD | 0.26 | 2 | 3.2 | 1.6 | 1 519.00 | 159.89 |
| GBPUSD | 0.16 | 0 | 2.4 | 1.6 | 1 607.60 | 169.22 |
| ERUUSD | 0.34 | 0 | 1.4 | 1.6 | 1 684.00 | 177.26 |
| EURJPY | 0.43 | 0 | 2.6 | 1.6 | 1 550.30 | 163.19 |
| EURAUD | 0.30 | 7 | 2.4 | 1.6 | 3 316.20 | 349.07 |
| Sum | 9 677.10 | 1 018.64 |
For XAUUSD (Gold), Cut Probability = 0.15, Box Buffer Pips =0, Take Profit = 1.3, Lot Multiplier = 1.6 return the total Net Pip gains of 27 265 pips during 9 month period and Monthly pip gains is 2 870 pips. So, it works very well for Gold, too.
Important Trading Parameters
- Cut Probability – you can enter from 0.01 to 0.99. The value will mostly stay between 0.05 and 0.5. This cut probability is the criteria to qualify the Sideways Movement of the current group of candle bars based on the probability distribution.
- Box Buffer Pips – you can enter from 0 to 100. The value will mostly stay between 0 and 10. The pip value is the offset distance from the detected Sideways Market. This will be represented by the long horizontal line above and below the detected Sideways Market on your chart. This line can be used as the trigger point for your buy and sell orders.
- Take Profit Ratio – the Ratio of your take profit pips/box height. The value will mostly stay between 1 and 3. 1 indicates that your take profit’s pips are equal to the height of the box.
- Lot Multiplier – Lot Multiplier is used when your previous trading hits stop loss. The value will mostly stay between 1.5 and 2.0. It is recommended to use the value less than 1.7.
Trading Strategy Guide
You can use Sideways Market Analzyer together with any of following technical analysis. In general, combining one or two price action analysis can improve the trading accuracy. This is the known fact confirmed by many experienced trader.
Guide for Volume Spread Analysis
Guide for Harmonic Pattern Detection Indicator
Guide for Momentum Indicator
Guide for Supply Demand Indicator
Guide for Triangle Pattern, Falling Wedge Pattern, Rising Wedge Pattern and Channel
Guide for Elliott Wave Indicator
Important Note
This is the off the shelf product. Therefore, we do not accept any modification or customization request on this product. In addition, we do not provide any code library or any support for your coding for this product.
![图片[1]-Sideways Market Statistical Analyzer MT5 外汇EA-EA侦探社 - 全球领先的MQL5官网外汇EA机器人MT4自动化交易EA资源免费分享网站](https://www.mql5.vip/wp-content/uploads/2024/05/20240513105620-6641f1d456391.png)
![图片[2]-Sideways Market Statistical Analyzer MT5 外汇EA-EA侦探社 - 全球领先的MQL5官网外汇EA机器人MT4自动化交易EA资源免费分享网站](https://www.mql5.vip/wp-content/uploads/2024/05/20240513105620-6641f1d4707c0.png)
![图片[3]-Sideways Market Statistical Analyzer MT5 外汇EA-EA侦探社 - 全球领先的MQL5官网外汇EA机器人MT4自动化交易EA资源免费分享网站](https://www.mql5.vip/wp-content/uploads/2024/05/20240513105620-6641f1d4895a8.png)
![图片[4]-Sideways Market Statistical Analyzer MT5 外汇EA-EA侦探社 - 全球领先的MQL5官网外汇EA机器人MT4自动化交易EA资源免费分享网站](https://www.mql5.vip/wp-content/uploads/2024/05/20240513105620-6641f1d4a2d1c.png)
![图片[5]-Sideways Market Statistical Analyzer MT5 外汇EA-EA侦探社 - 全球领先的MQL5官网外汇EA机器人MT4自动化交易EA资源免费分享网站](https://www.mql5.vip/wp-content/uploads/2024/05/20240513105620-6641f1d4bc091.png)
![图片[6]-Sideways Market Statistical Analyzer MT5 外汇EA-EA侦探社 - 全球领先的MQL5官网外汇EA机器人MT4自动化交易EA资源免费分享网站](https://www.mql5.vip/wp-content/uploads/2024/05/20240513105620-6641f1d4d4cf3.png)
![图片[7]-Sideways Market Statistical Analyzer MT5 外汇EA-EA侦探社 - 全球领先的MQL5官网外汇EA机器人MT4自动化交易EA资源免费分享网站](https://www.mql5.vip/wp-content/uploads/2024/05/20240513105620-6641f1d4edc84.png)
![图片[8]-Sideways Market Statistical Analyzer MT5 外汇EA-EA侦探社 - 全球领先的MQL5官网外汇EA机器人MT4自动化交易EA资源免费分享网站](https://www.mql5.vip/wp-content/uploads/2024/05/20240513105621-6641f1d512a1e.png)
![图片[9]-Sideways Market Statistical Analyzer MT5 外汇EA-EA侦探社 - 全球领先的MQL5官网外汇EA机器人MT4自动化交易EA资源免费分享网站](https://www.mql5.vip/wp-content/uploads/2024/05/20240513105621-6641f1d52c0e6.png)
![图片[10]-Sideways Market Statistical Analyzer MT5 外汇EA-EA侦探社 - 全球领先的MQL5官网外汇EA机器人MT4自动化交易EA资源免费分享网站](https://www.mql5.vip/wp-content/uploads/2024/05/20240513105621-6641f1d545e9d.png)