
|
如果免费资源下载的文件为TXT文档 请联系站长更新!站长微信:Lv596999 Telegram:@eapoj “Mql5官网”板块的EA基本都有,大部分是无限制NODLL版,NODLL版本MT1420升级,大多数不可用!这些EA来源为国外花钱买过来的 如有需要,请联系站长! “EA测评”板块资源全部现有,看见不错的,可以联系站长,看EA在确定是否收费。 “无限制EA”板块,大部分免费,下载文件全部存在,都可以免费下载。 站长硬盘EA太多,因大部分时间做交易,做风控,没太多时间更新下载地址,请谅解! 需要更新下载文件,请联系站长微信!国外朋友请联系Telegram。  |
This tool gives you the opportunity to display pivot point support and resistance levels as well as the daily open, weekly close and
monthly close levels on your chart with high levels of customization.
Pivot points are important horizontal support and resistance levels that get calculated using the high, low and closing price of the
previous period (for example D1). With this indicator, you can choose between hourly to monthly timeframes to base your pivot point
calculation on.
There is a variety of trading strategies taking advantage of pivot points and daily opens, weekly close and monthly close which is partly
why they are so important: they simply get used by a lot of traders!
Why “Professional Pivot Points”
As I have already mentioned, pivot point levels are highly important support and resistance levels. But as every chart reacts
differently to often the same signals, it is extremely important to understand how you can trade those signals for each chart
individually.
Most other pivot point indicators do simply not offer the option to show historical levels or select a time shift, although that can be
vitally important for your understanding of the markets, therefore for your trading success and to find a trading strategy that suits
you and the market best.
This indicator offers various personalization options to make it fit your taste. I will explain everything you need to know about the
customization options further below in the section “Input Parameters”.
You can even easily show different levels of multiple timeframes and pivot calculation modes on one chart by simultaneously running the
program side by side as many times as you want, each time with different settings (see screenshots). If levels of different timeframes
or calculation methods overlap, this tells you that there is an especially strong support or resistance in this area.
Input Parameters
- Pivot Point Method – Select a method for calculating the pivot points (Standard, Woodie, Camarilla, Fibonacci and
DeMark). - Fibonacci Pivot Points Levels – Select which Fibonacci levels your Fibonacci pivots should be based upon.
- Show Fibonacci Levels – Select whether or not you would like to have labels for each Fibonacci level to display which
level it is. - Pivot Timeframe – Choose a timeframe for the pivot point calculation (H4, D1, W1, MN1).
- Time Shift – This Option lets you mimic the way the daily pivot points would be displayed in different time zones. For
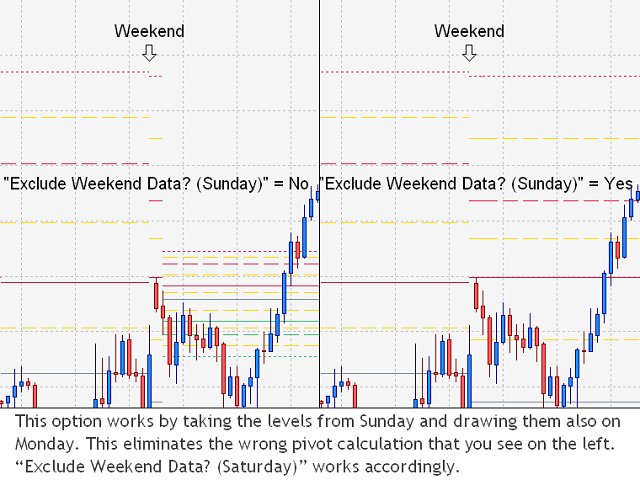
example, a time shift of 1 would simulate pivot points from a time zone that is one hour “behind” your own time zone. - Exclude Weekend Data (Market open on Sundays) – If the (forex) market opens on Sundays, this option will prevent
you from getting wrong pivot points displayed on Mondays by using data from before the weekend. - Exclude Weekend Data (Market close on Saturdays) – If the (forex) market closes on Saturdays, you can use this
option to draw the pivot points over the weekend. - Visible – Set if the levels should be visible.
- Show History – Set if historical levels should be displayed on your chart.
- Show Pivot Levels / Daily Open / Weekly Close / Weekly High and Low / Monthly Close – Set if the pivot
point, daily open, weekly close weekly high/low and monthly close levels should be displayed on your chart. - Show Mid Pivot Levels – If you display pivot points on your chart, you can select if mid-pivot levels should also be
displayed. - Save Object Resources – This option lets you reduce the history size (number of levels on the chart) and therefore
reduce loading times and use of resources. - Draw as Background – Lets you draw the pivot levels as the background of the chart, so that they cannot cover up the
charts. - Pivot Data Timeframe – If the levels display incorrectly, you can try changing this option to try to fix it.
Sometimes, the data of one timeframe might be incomplete or otherwise corrupted. - Current and Historical Level Width, Style and Color – Choose your current and historical level width, style
and color individually.
Note
- If you want to get an impression of how it works, you can download my product ‘Easy
Daily Open’ for free. It uses mainly the same algorithms and is only reduced to the Daily Open function. - If you experience any problems with the program, please send me a message so that we can solve it.
![图片[1]-Professional Pivot Points 外汇EA-EA侦探社 - 全球领先的MQL5官网外汇EA机器人MT4自动化交易EA资源免费分享网站](https://www.mql5.vip/wp-content/uploads/2024/05/20240514103540-66433e7c87aec.png)
![图片[2]-Professional Pivot Points 外汇EA-EA侦探社 - 全球领先的MQL5官网外汇EA机器人MT4自动化交易EA资源免费分享网站](https://www.mql5.vip/wp-content/uploads/2024/05/20240514103540-66433e7ca4353.png)
![图片[3]-Professional Pivot Points 外汇EA-EA侦探社 - 全球领先的MQL5官网外汇EA机器人MT4自动化交易EA资源免费分享网站](https://www.mql5.vip/wp-content/uploads/2024/05/20240514103540-66433e7cbf3b4.png)
![图片[4]-Professional Pivot Points 外汇EA-EA侦探社 - 全球领先的MQL5官网外汇EA机器人MT4自动化交易EA资源免费分享网站](https://www.mql5.vip/wp-content/uploads/2024/05/20240514103540-66433e7cd9111.png)
![图片[5]-Professional Pivot Points 外汇EA-EA侦探社 - 全球领先的MQL5官网外汇EA机器人MT4自动化交易EA资源免费分享网站](https://www.mql5.vip/wp-content/uploads/2024/05/20240514103541-66433e7d032f1.png)
![图片[6]-Professional Pivot Points 外汇EA-EA侦探社 - 全球领先的MQL5官网外汇EA机器人MT4自动化交易EA资源免费分享网站](https://www.mql5.vip/wp-content/uploads/2024/05/20240514103541-66433e7d1ebf9.png)
![图片[7]-Professional Pivot Points 外汇EA-EA侦探社 - 全球领先的MQL5官网外汇EA机器人MT4自动化交易EA资源免费分享网站](https://www.mql5.vip/wp-content/uploads/2024/05/20240514103541-66433e7d42656.png)
![图片[8]-Professional Pivot Points 外汇EA-EA侦探社 - 全球领先的MQL5官网外汇EA机器人MT4自动化交易EA资源免费分享网站](https://www.mql5.vip/wp-content/uploads/2024/05/20240514103541-66433e7d5d0eb.png)
![图片[9]-Professional Pivot Points 外汇EA-EA侦探社 - 全球领先的MQL5官网外汇EA机器人MT4自动化交易EA资源免费分享网站](https://www.mql5.vip/wp-content/uploads/2024/05/20240514103541-66433e7d77757.png)
![图片[10]-Professional Pivot Points 外汇EA-EA侦探社 - 全球领先的MQL5官网外汇EA机器人MT4自动化交易EA资源免费分享网站](https://www.mql5.vip/wp-content/uploads/2024/05/20240514103541-66433e7d94700.png)
![图片[11]-Professional Pivot Points 外汇EA-EA侦探社 - 全球领先的MQL5官网外汇EA机器人MT4自动化交易EA资源免费分享网站](https://www.mql5.vip/wp-content/uploads/2024/05/20240514103541-66433e7db3c3c.png)