
|
如果免费资源下载的文件为TXT文档 请联系站长更新!站长微信:Lv596999 Telegram:@eapoj “Mql5官网”板块的EA基本都有,大部分是无限制NODLL版,NODLL版本MT1420升级,大多数不可用!这些EA来源为国外花钱买过来的 如有需要,请联系站长! “EA测评”板块资源全部现有,看见不错的,可以联系站长,看EA在确定是否收费。 “无限制EA”板块,大部分免费,下载文件全部存在,都可以免费下载。 站长硬盘EA太多,因大部分时间做交易,做风控,没太多时间更新下载地址,请谅解! 需要更新下载文件,请联系站长微信!国外朋友请联系Telegram。  |
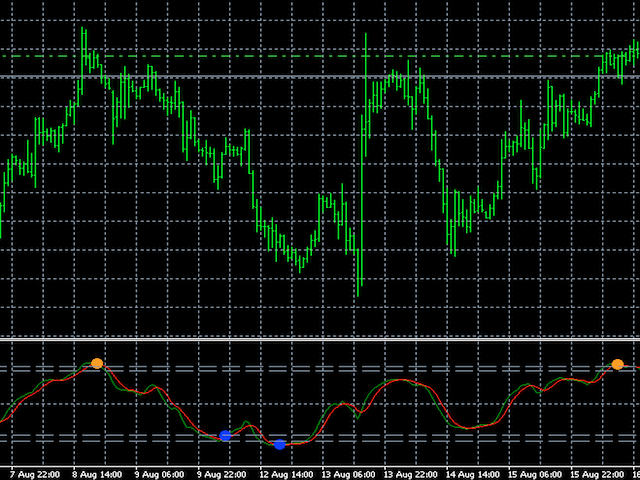
Custom Relative Strength Indicator with multiple timeframe selection
About RSI
The relative strength index is a technical indicator used in the analysis of financial markets. It is intended to chart the current and historical strength or weakness of a stock or market based on the closing prices of a recent trading period.
Features
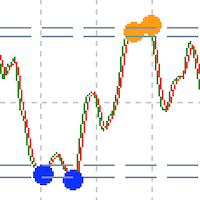
Indicator gives alert when reached oversold or overbought levels
Gives dot indication while reaching levels.
Can set indicator bar alert intervals for alerts
Can choose needed timeframe. So you can see other timeframe RSI values in your chart.
Important :- Do not relay fully on this indicator while trading. Use with other indicators like CyberZingFx Trend Reversal for confirmation and trade