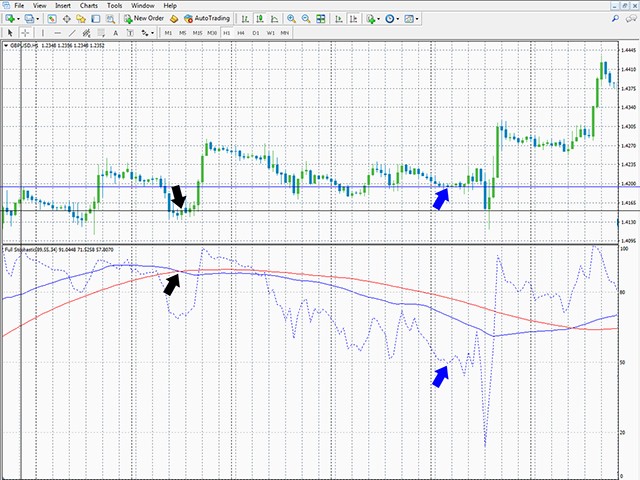
Full Stochastic – is Stochastic Oscillator which displays all three essential lines:
- %K
- Slow K
- %D
Standard Stochastic Oscillators displays only Slow K and %D.
Why it is important to analyze all three lines in SO?
Standard SO users must choose if they want to use fast or slow SO. In case of fast SO traders set the slowing parameter typically to 1 or 2, or if they want to use slow SO, they set the slowing parameter usually to 3 or more.
With Full Stochastic you can have both!
Full Stochastic Parameters
- K Period (Default: 89) – %K calculation period
- Slow K Period (Default: 55)- Slow K calculation period
- D Period (Default: 34)- %D calculation period
- Indicator Name (Default: Minimal) – amount of name details
- Line Description (Default: Moderate) – amount of line info details
- K, Slow K, D Line visibility
K-Line
The fastest line of the oscillator. It is displayed as a dotted blue line by default.
Slow K-Line
Medium speed line. It is slower than K-Line, but faster than D-Line. It is calculated as a moving average of the K-Line. By default it is displayed as a solid blue line.
D-Line
The slowest line of the oscillator. It is calculated as a moving average of a Slow K-Line. By default it is displayed as a full red line.
How to use Full Stochastic indicator?
Full Stochastic can be used in any way a standard Stochastic Oscillator can be used, but with an advantage because you can see both fast and slow oscillator at the same time. That means you can use your favorite strategy in a better way.
With Full Stochastic you can do even more – you can use it in ways you can not with standard SO.
Example strategy: Slow K and %D Crossover Above 80 or Below 20 and %K Crossing 50
The basic idea is to wait until Slow K and %D go out of the 20-80 range and for %K Line to be close by them. Then if Slow K and %D crossover each other, and %K line goes back and crosses level 50, and the price on main chart moves in the desired direction the position is opened. The movement of price is measured between the close of candle in which the crossing of Slow K and %D has occurred and the close of %K crossing level 50 candle.
Stop loss is to be set on the worst price level of the worst candle between the close of candle in which the crossing of Slow K and %D has occurred and the close of %K crossing level 50 candle. The worst price insures that the SL is the safest logically possible.
Position should be closed when Slow K and %K lines go to the opposite end and crossover each other out of the 20 – 80 range.
Example of a good signal can be seen on first screenshot. Black arrows are showing Slow K and %D crossing point and the candle in which the crossing has occurred. Black line shows the close price of the crossing candle. Because the crossing is below level 20, it is a BUY signal. Blue arrows are showing %K crossing level 50 and the candle in which that crossing has occurred. Blue line shows the close price of the %K crossing level 50 candle. Because it is a BUY signal, we check if the price has moved up between black and blue lines, and it has, so it is a confirmation that the BUY signal is valid and we open BUY position at the close price of blue arrow candle. Now we are looking at the candles between the black and the blue arrow, we search the farthest candle from the desired direction. Because it is a BUY signal, we look for the candle with the lowest low. Red arrow is showing the candle with the lowest low, and that low will be our Stop Loss. Red line is showing Stop Loss. At last, because it is a BUY order we wait for Slow K and %K to go all the way over level 80 and to crossover above it and that is when we close our position.
On the second screenshot we see a different situation: a false signal. Simply put – the signal is not valid because the price at the blue arrow is worse than the price at the black arrow. Slow K and %D had crossed above the 80 level, so it is a SELL signal, but the price at the moment %K is crossing the level 50 is higher than the price when SELL signal occurred, so we do not open SELL position. The price action is not in our favour so we pass this signal.
Above strategy is just a basic example, there are many more things to consider, and the best practice is to check for even more confirmations and pick only the very best trades. Always use a common sense while trading, trading is a risky business. As with all indicators, there is a margin for errors. Not all signals are valid.
![图片[1]-Full Stochastic 外汇EA-EA侦探社 - 全球领先的MQL5官网外汇EA机器人MT4自动化交易EA资源免费分享网站](https://www.mql5.vip/wp-content/uploads/2024/05/20240514105026-664341f24d754.jpg)


