
|
如果免费资源下载的文件为TXT文档 请联系站长更新!站长微信:Lv596999 Telegram:@eapoj “Mql5官网”板块的EA基本都有,大部分是无限制NODLL版,NODLL版本MT1420升级,大多数不可用!这些EA来源为国外花钱买过来的 如有需要,请联系站长! “EA测评”板块资源全部现有,看见不错的,可以联系站长,看EA在确定是否收费。 “无限制EA”板块,大部分免费,下载文件全部存在,都可以免费下载。 站长硬盘EA太多,因大部分时间做交易,做风控,没太多时间更新下载地址,请谅解! 需要更新下载文件,请联系站长微信!国外朋友请联系Telegram。  |
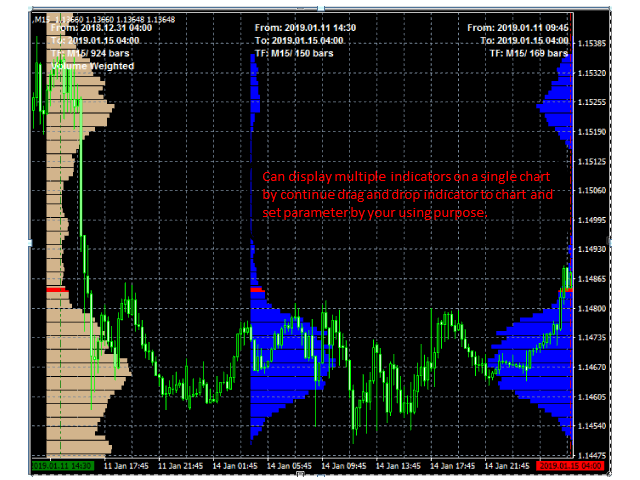
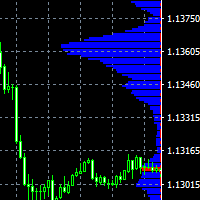
The indicator displays price distribution on a horizontal histogram.
Horizontal histogram help find out key levels of price so that you
can make good decision on setting point of take profit, stop loss…
You can improve exist trading strategy or get new trading idea with the histogram of price.
Outstanding features
Support multiple time frame: you can choose to work with history data in any time frame you want. It does not depend on current display time frame.
Support weighting by volume and/or time:
the distribution histogram of price can be calculated with volume
weighted and/or time (newer prices have higher weight than old price).
Full control on history data selection: we provide a set of parameters so that trader can choose history data in the most flexibility way.
Flexible on histogram displaying: support multiple histogram on a chart windows, can resize and change position/direction/color … for histogram.
How to use
Step 1: select period of data history to calculate histogram(can use default value).
Step 2: select the way to display histogram (can use default value).
Step 3: enjoy the price distribution histogram. I am sure that
you would get many new trading ideas by price histogram and it is also
used to improve your exist trading strategy.
Parameters
Part 1: to specify history data(data frame, start point, end point, data length).
- DATA TIME FRAME: data frame of history data on which distribution price is calculated.
- LAST_POINT_OF_DATA_OPTION: how do we specify the last point of history data? we have 5 options to specify it.
- UP_TO_NEWEST_BAR: the last point history data is before the last candle stick (position 0).
- UP_TO_LAST_VISIBLE_BAR: the last point of history data is the right most candlestick on the current chart and converted to selected time frame.
- UP_TO_FIRST_VISIBLE_BAR: the last point of history data is the first visible bar on the current chart and converted to selected time frame.
- UP_TO_SPECIFIED_X_AXIS:
the last point of history data is the candlestick at X axis on current
chart. The value of X axis is specified by parameter <LAST_POINT_OF_DATA_X_AXIS> - UP_TO_SPECIFIED_TIME: the last point of history data is specified by time. The value is specified by parameter <LAST_POINT_OF_DATA_IN_TIME>
- HISTORY_DATA_LENGTH_OPTION:
this is the option to specify length of history data. It means how to
calculate the start point of history data base on last point of history
data. There are 4 options for this parameter. - BY_DAY_COUNT: to specify data length by days of data. In this case, number of days of history data is specified by parameter <HISTORY_DATA_LENGTH_IN_DAYS>
- BY_BAR_COUNT:
to specify data length by number of bars on selected data time frame.
In this case, number of bars of history data is specified by parameter
<HISTORY_DATA_LENGTH_IN_BARS> - FROM_FIRST_VISIBLE_BAR: the start point of history data is the first visible bar on the current chart and converted to selected time frame.
- FROM_SPECIFIED_TIME: the start point of history data is specified by time. The value is specified by parameter <START_POINT_OF_DATA_IN_TIME>
Part 2: to specify option for data weighting.
- USE_VOLUME_WEIGHT: to turn on/off weight of volume data on distribution price histogram.
- USE_TIME_WEIGHT: to turn on/off weight of time on distribution price histogram. Price of new bar has more weight than price of old bar.
Part 3: to specify display option of histogram.
- HISTOGRAM_DISPLAY_OPTION: there are two option: RIGHT_TO_LEFT (default) and LEFT_TO_RIGHT
- HISTOGRAM_X_AXIS: the X axis value of histogram. This value depend on <HISTOGRAM_DISPLAY_OPTION>
- HISTOGRAM_WIDTH: the width in pixel of histogram. Default is 100 pixels.
- GRID_SIZE_IN_POINT: size of grid in histogram. the value is in point of price.
- PRICE_HISTOGRAM_COLOR: color of histogram.
- HIGHLIGHT_LAST_HIS_PRICE: to
turn on/off highlight part in histogram. If this option is turned on.
Histogram will highlight the area it is near value of last history
price. - HIGHLIGHT_COLOR: color of highlight part in histogram.
- HIGHLIGHT_WIDTH: height in pixel of highlight part in histogram.
Part 4: to turn on/off marking history data area.
Part 5: to turn on/off displaying comment for histogram.
![图片[1]-Vanesa price distribution 外汇EA-EA侦探社 - 全球领先的MQL5官网外汇EA机器人MT4自动化交易EA资源免费分享网站](https://www.mql5.vip/wp-content/uploads/2024/05/20240514105304-664342902ca4f.png)
![图片[2]-Vanesa price distribution 外汇EA-EA侦探社 - 全球领先的MQL5官网外汇EA机器人MT4自动化交易EA资源免费分享网站](https://www.mql5.vip/wp-content/uploads/2024/05/20240514105304-66434290c4c72.png)
![图片[3]-Vanesa price distribution 外汇EA-EA侦探社 - 全球领先的MQL5官网外汇EA机器人MT4自动化交易EA资源免费分享网站](https://www.mql5.vip/wp-content/uploads/2024/05/20240514105305-6643429146322.png)
![图片[4]-Vanesa price distribution 外汇EA-EA侦探社 - 全球领先的MQL5官网外汇EA机器人MT4自动化交易EA资源免费分享网站](https://www.mql5.vip/wp-content/uploads/2024/05/20240514105305-664342918c2af.png)
![图片[5]-Vanesa price distribution 外汇EA-EA侦探社 - 全球领先的MQL5官网外汇EA机器人MT4自动化交易EA资源免费分享网站](https://www.mql5.vip/wp-content/uploads/2024/05/20240514105305-66434291b0105.png)