
|
如果免费资源下载的文件为TXT文档 请联系站长更新!站长微信:Lv596999 Telegram:@eapoj “Mql5官网”板块的EA基本都有,大部分是无限制NODLL版,NODLL版本MT1420升级,大多数不可用!这些EA来源为国外花钱买过来的 如有需要,请联系站长! “EA测评”板块资源全部现有,看见不错的,可以联系站长,看EA在确定是否收费。 “无限制EA”板块,大部分免费,下载文件全部存在,都可以免费下载。 站长硬盘EA太多,因大部分时间做交易,做风控,没太多时间更新下载地址,请谅解! 需要更新下载文件,请联系站长微信!国外朋友请联系Telegram。  |
TDI Multi Timeframe Scanner:
This Dashboard indicator uses the TDI (Trader’s Dynamic Index) Indicator to find best trades.
Extra indicators and detailed description is here:
https://abiroid.com/product/tdi-scanner-dashboard
Checks for:
– SharkFin Pattern
Free indicator for SharkFin:
https://www.mql5.com/en/market/product/42405/
– TDI Trend: Strong/Weak Trend Up/Down
– TDI Signal: Strong/Medium/Weak Signal for Buy/Sell
– Consolidation
– Overbought/Oversold
– Volatility Bands
– Previous Day/Week/Month High/Low
What each button means (examples):
– If TDI Trend and TDI Signal both strong then a Green or Red BUY or SELL button
Left diamond is for trend:
– Green means Strong Up and Red means Strong Down
– Dark Green means Weak Up and Dark Red means Weak Down
Right (small diamond) Icon is for Volatility:
– White means high volatility
– Yellow means medium volatility
– Black means very low volatility
Middle Text is for TDI Signals:
– SFin means SharkFin pattern detected
– “D1 Hi” or “D1 Lo” means Previous Day High or Low Crossed
– Green B: Strong Buy, Red S: Strong Sell
– Green MB: Medium Buy and Red MS: Medium Sell
– Lighter Green WB: Weak Buy and Lighter Red WS: Weak Sell
– Yellow OB: Overbought and OS: Oversold
– Blue C: Trend Consolidation
Settings:
Detailed Common Dash Settings:
https://www.mql5.com/en/blogs/post/747456
– Specify your Own Pairs (comma-separated list). Or select a pairs list from our drop-down for forex pairs like “Forex Core 7”, “Forex Core 14”, etc.
– Specify your own preferred time frames in a comma-separated list.
– Settings for showing alerts: Popup, email, sound alerts, etc.
– x_axis, y_axis: to position Scanner Dashboard
– fontSize: to resize the whole panel and it’s fonts. For best experience use fontSize between 5 and 8.
– ColumnsNum: Number of Dashboard Columns
– OnButtonClick Open New Window: On clicking any dash buttons open that Pair-TimeFrame in a new window with your specified template (next setting)
– Use Template for New Window: Template name without “.tpl”. Eg: Create a file Template1.tpl in templates folder and here specify: “Template1”.
(only works if previous property set to true). Does not work if on button click is set to open in current window because otherwise you might lose your current window indicators or existing dashboard settings.
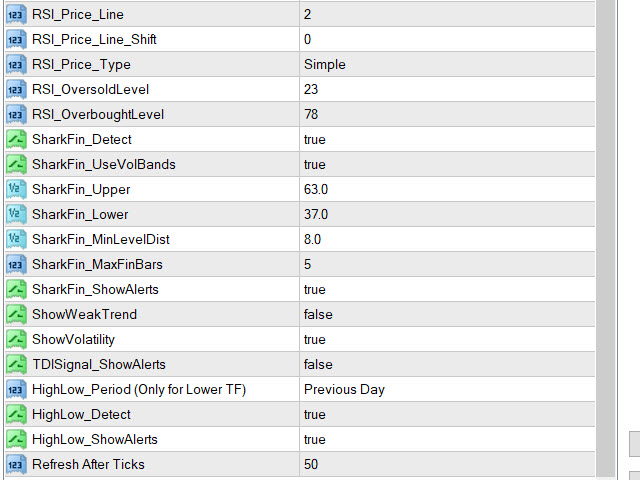
– ShowWeakTrend: true/false To Show left diamond if trend is weak or not
– ShowVolatility: true/false To Show right diamond for volatility or not
– Refresh After Ticks (if shift 0): For shift 0, wait for this number of ticks before refreshing everytime. By default 100. If you want this to refresh faster specify a lower number.
For higher TF use a higher number like 300 or 500.
SharkFin:
– Detect: true/false
– UseVolBands: Check Volatility Bands Cross along with SharkFin pattern
– Upper/Lower Levels: RSI Levels where price crosses and comes back to create a SharkFin
– MinLevelDist: Minimum distance from RSI Upper/Lower Level (for valid Sharkfin)
– MaxFinBars: Max no of bars within which pattern should be created
High/Low:
– Detect: true/false
– Period: Previous Day/Week/Month
How to Trade:
Best way to use this indicator is with Support and Resistance, Fibo or other such supporting Indicators. Or any other indicator which might validate that trend is still strong and not near an SR Zone.
Use volatility for further checking the signal. Don’t trade when volatility diamond is black and trade carefully when Overbought or Oversold.
You can also use RSI and V-Bands patterns to trade. Like when an RSI “M” forms slightly outside the V-Bands, trade Sell if high volatility. Or if a “W” forms trade Buy.
Important Note:
– Please don’t use too many Timeframes and too many Pairs because Scanner will need to scan each and every one and might get slower the more pairs you select.
– Best is to trade trending markets for higher timeframes. For lower timeframes, scalping sideways markets also works well with TDI.
![图片[1]-TDI Scanner Dashboard 外汇EA-EA侦探社 - 全球领先的MQL5官网外汇EA机器人MT4自动化交易EA资源免费分享网站](https://www.mql5.vip/wp-content/uploads/2024/05/20240514105820-664343cc6fe69.jpg)
![图片[2]-TDI Scanner Dashboard 外汇EA-EA侦探社 - 全球领先的MQL5官网外汇EA机器人MT4自动化交易EA资源免费分享网站](https://www.mql5.vip/wp-content/uploads/2024/05/20240514105820-664343cc964ff.jpg)
![图片[3]-TDI Scanner Dashboard 外汇EA-EA侦探社 - 全球领先的MQL5官网外汇EA机器人MT4自动化交易EA资源免费分享网站](https://www.mql5.vip/wp-content/uploads/2024/05/20240514105820-664343ccbaa0c.jpg)
![图片[4]-TDI Scanner Dashboard 外汇EA-EA侦探社 - 全球领先的MQL5官网外汇EA机器人MT4自动化交易EA资源免费分享网站](https://www.mql5.vip/wp-content/uploads/2024/05/20240514105820-664343ccddcdd.jpg)
![图片[5]-TDI Scanner Dashboard 外汇EA-EA侦探社 - 全球领先的MQL5官网外汇EA机器人MT4自动化交易EA资源免费分享网站](https://www.mql5.vip/wp-content/uploads/2024/05/20240514105821-664343cd0d57f.jpg)
![图片[6]-TDI Scanner Dashboard 外汇EA-EA侦探社 - 全球领先的MQL5官网外汇EA机器人MT4自动化交易EA资源免费分享网站](https://www.mql5.vip/wp-content/uploads/2024/05/20240514105821-664343cd32124.jpg)
![图片[7]-TDI Scanner Dashboard 外汇EA-EA侦探社 - 全球领先的MQL5官网外汇EA机器人MT4自动化交易EA资源免费分享网站](https://www.mql5.vip/wp-content/uploads/2024/05/20240514105821-664343cd5680b.jpg)
![图片[8]-TDI Scanner Dashboard 外汇EA-EA侦探社 - 全球领先的MQL5官网外汇EA机器人MT4自动化交易EA资源免费分享网站](https://www.mql5.vip/wp-content/uploads/2024/05/20240514105821-664343cd78b92.jpg)