|
如果免费资源下载的文件为TXT文档 请联系站长更新!站长微信:Lv596999 Telegram:@eapoj “Mql5官网”板块的EA基本都有,大部分是无限制NODLL版,NODLL版本MT1420升级,大多数不可用!这些EA来源为国外花钱买过来的 如有需要,请联系站长! “EA测评”板块资源全部现有,看见不错的,可以联系站长,看EA在确定是否收费。 “无限制EA”板块,大部分免费,下载文件全部存在,都可以免费下载。 站长硬盘EA太多,因大部分时间做交易,做风控,没太多时间更新下载地址,请谅解! 需要更新下载文件,请联系站长微信!国外朋友请联系Telegram。  |
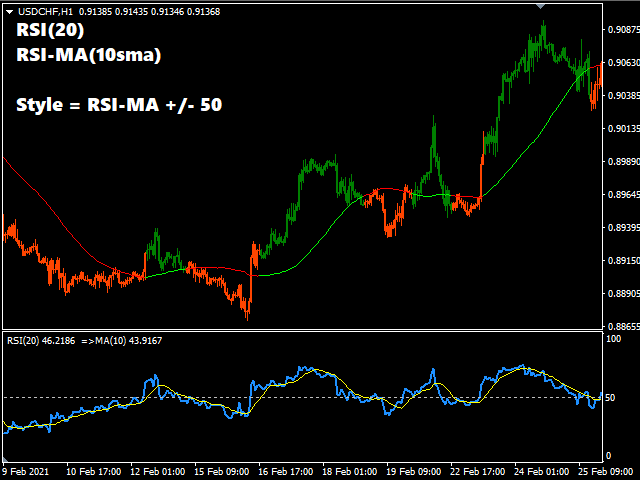
See RSI values turned into colored candles
This indicator provides both colored candles and a colored moving average. 6 drawaing styles are provided to allow customization of the color coding.
Applying coding to the chart may help in conceptualizing price trend and impulse movements defined through RSI values.
Features
– optional colored candles
– optional colored ma
– 6 draw styles;
- RSI slope
- RSI above/below overbought/oversold levels
- RSI above/below level 50
- RSI above/below it’s moving average
- RSI-MA slope
- RSI-MA above/below 50
Troubleshooting:
– if you do not see any colored candles, unselect the “chart on foreground” option in the common tab of the chart properties (right click on chart, select properties).
– If there are any issues or suggestions for the indicator, please comment and let me know. The feedback will be noted and considered in future updates.