
|
如果免费资源下载的文件为TXT文档 请联系站长更新!站长微信:Lv596999 Telegram:@eapoj “Mql5官网”板块的EA基本都有,大部分是无限制NODLL版,NODLL版本MT1420升级,大多数不可用!这些EA来源为国外花钱买过来的 如有需要,请联系站长! “EA测评”板块资源全部现有,看见不错的,可以联系站长,看EA在确定是否收费。 “无限制EA”板块,大部分免费,下载文件全部存在,都可以免费下载。 站长硬盘EA太多,因大部分时间做交易,做风控,没太多时间更新下载地址,请谅解! 需要更新下载文件,请联系站长微信!国外朋友请联系Telegram。  |
Tired of using the same technical indicators?
The “Tekno RSI” is an innovative tool designed to make the interpretation of the Relative Strength Index (RSI) more intuitive and accessible to traders of all levels. It displays the RSI as a 3-color histogram, providing a clear and intuitive visual representation of market conditions.
1)Key Features
3-Color Histogram: RSI is a versatile indicator providing insights into market direction and potential reversal points. However, when analyzing the chart, especially during backtesting, it can be challenging to have an intuitive visualization of RSI and the chart simultaneously, leading traders astray. This issue is solved by the 3-color visualization of RSI values provided by this indicator: Overbought, Oversold, and Neutral. Three distinct colors make the instant understanding of market conditions easy, providing greater objectivity on the chart.
Moving Averages on RSI: Traders often set entry conditions based on RSI being above or below a certain value. However, without a filter to evaluate the appropriate RSI value under changing market conditions, this can easily be misleading. That’s why the “Tekno RSI” includes moving averages calculated on RSI, allowing for the assessment of the direction and speed of the change in the historical RSI values. This provides an extra level of accuracy by graphically displaying the distance between the two averages of RSI values in the past and the current value.
Dynamic Analysis: Combining the aforementioned points with the text displayed on the price chart allows for visualizing whether the RSI is increasing, decreasing, or stable. This provides a clear indication of the trend and its strength based on the historical series, not just the current indicator value.
Anomaly Detection: Understanding when RSI signals excess demand or supply is usually challenging. Fixed values can be used, but they may lack high accuracy, leading to long-term losses if a system relies solely on them. The “Tekno RSI” indicator provides a more concrete advantage in terms of identifying anomalous oscillations in RSI, allowing traders to quickly grasp significant changes.
2)Exclusive Trading Tools
Alerts for RSI Excursions: Receive alerts when the RSI exceeds a threshold relative to its historical average, helping you identify extreme price movements and act promptly when other checklist conditions are met.
Alerts for Moving Average Crossovers: Highlight critical moments with notifications for crossovers between moving averages on RSI, indicating potential trend reversals. They can be implemented in a trend-following system, providing additional support to your strategy and potentially increasing the win rate through the use of this tool.
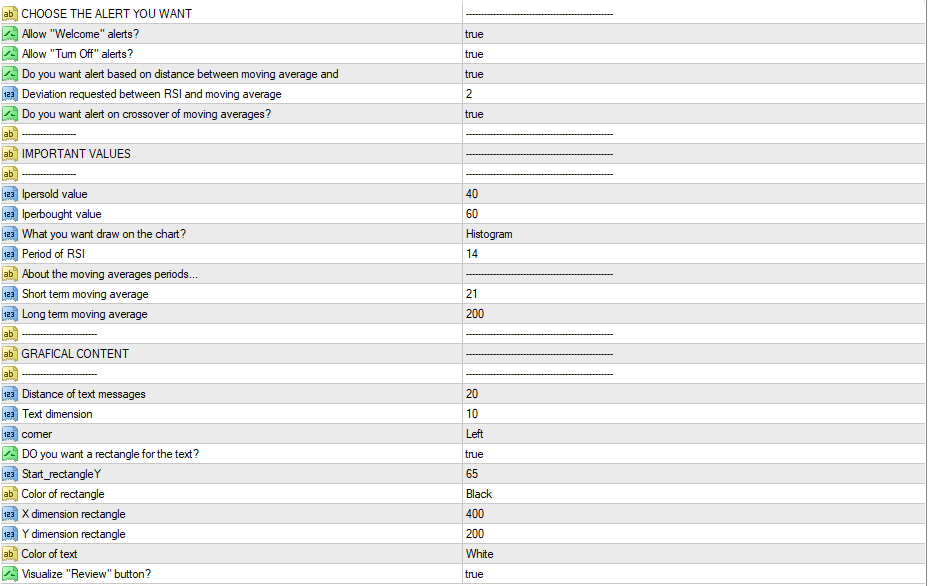
Versatility and User-Friendliness:
- Customize settings based on your trading preferences and preferred graphical representation.
- Clear and intuitive representation for traders of all experience levels.
This indicator, combined with a good trigger, operational filters, and proper risk management, can be used to create highly profitable long-term trading strategies.
Feel ready to have a powerful tool at your disposal for COMPLETELY FREE?
Download now and transform your RSI analysis into a trading strategy that brings you success in the markets!
![图片[1]-Tekno RSI 外汇EA-EA侦探社 - 全球领先的MQL5官网外汇EA机器人MT4自动化交易EA资源免费分享网站](https://www.mql5.vip/wp-content/uploads/2024/05/20240514121536-664355e806ae6.jpg)
![图片[2]-Tekno RSI 外汇EA-EA侦探社 - 全球领先的MQL5官网外汇EA机器人MT4自动化交易EA资源免费分享网站](https://www.mql5.vip/wp-content/uploads/2024/05/20240514121536-664355e8357e8.png)
![图片[3]-Tekno RSI 外汇EA-EA侦探社 - 全球领先的MQL5官网外汇EA机器人MT4自动化交易EA资源免费分享网站](https://www.mql5.vip/wp-content/uploads/2024/05/20240514121536-664355e86a811.png)
![图片[4]-Tekno RSI 外汇EA-EA侦探社 - 全球领先的MQL5官网外汇EA机器人MT4自动化交易EA资源免费分享网站](https://www.mql5.vip/wp-content/uploads/2024/05/20240514121536-664355e8a0c91.jpg)