
|
如果免费资源下载的文件为TXT文档 请联系站长更新!站长微信:Lv596999 Telegram:@eapoj “Mql5官网”板块的EA基本都有,大部分是无限制NODLL版,NODLL版本MT1420升级,大多数不可用!这些EA来源为国外花钱买过来的 如有需要,请联系站长! “EA测评”板块资源全部现有,看见不错的,可以联系站长,看EA在确定是否收费。 “无限制EA”板块,大部分免费,下载文件全部存在,都可以免费下载。 站长硬盘EA太多,因大部分时间做交易,做风控,没太多时间更新下载地址,请谅解! 需要更新下载文件,请联系站长微信!国外朋友请联系Telegram。  |
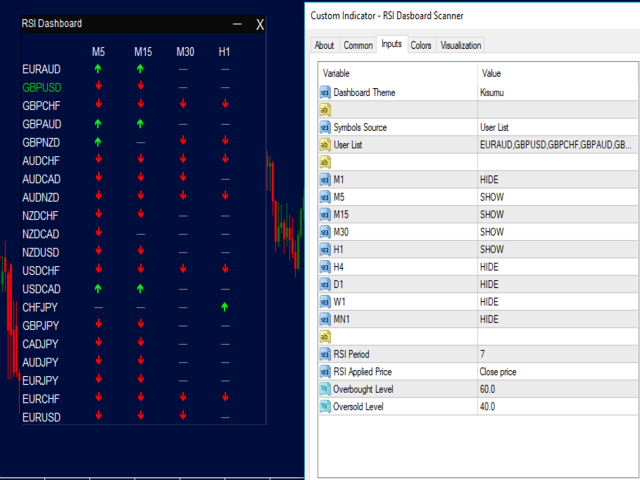
This indicator scans multiple pairs on multiple timeframes for RSI values and draws green up arrows for RSI overbought values and red down arrows for oversold RSI values in realtime.
Features •Animated rows plotting •Resizable •Repositionable •Minimisable •Multiple dashboard themes •Multiple timeframes •You can open a pair by clicking it •Current chart pair marked by a different color •Use market watch pairs or your own list of pairs •Choose the timeframes to display ![图片[1]-RSI Dashboard Scanner 外汇EA-EA侦探社 - 全球领先的MQL5官网外汇EA机器人MT4自动化交易EA资源免费分享网站](https://www.mql5.vip/wp-content/uploads/2024/05/20240514125854-6643600e32964.png)