
|
如果免费资源下载的文件为TXT文档 请联系站长更新!站长微信:Lv596999 Telegram:@eapoj “Mql5官网”板块的EA基本都有,大部分是无限制NODLL版,NODLL版本MT1420升级,大多数不可用!这些EA来源为国外花钱买过来的 如有需要,请联系站长! “EA测评”板块资源全部现有,看见不错的,可以联系站长,看EA在确定是否收费。 “无限制EA”板块,大部分免费,下载文件全部存在,都可以免费下载。 站长硬盘EA太多,因大部分时间做交易,做风控,没太多时间更新下载地址,请谅解! 需要更新下载文件,请联系站长微信!国外朋友请联系Telegram。  |
GOLDEN RETRACEMENT POWER indicator draws fibonacci levels automatically. Defines the golden entry buy/sell area, support and resistant lines , signals arrows and strength ‘Power Bars Level’ based on price action . Some indicators also work behind the chart: Stochastic,RSI,MFI,DeMarker and WPR .
Fibonacci retracements are a popular form of technical analysis used by traders in order to predict future potential prices in the financial markets. If used correctly, Fibonacci retracements and ratios can help traders to identify upcoming support and resistance levels based on past price action.
From those ratios , we believe there is the best one that provide the strong retracement signal that we call it as the golden retracement area.
GOLDEN RETRACEMENT POWER indicator is the combination of price action , high-low strategy and fibonacci ‘golden’ retracement.
Recommended Timeframes : M15-H1. Even though it can work on any timeframe
Symbols: Any
INDICATOR SETTING
Select Timeframe = There are 2 option : Defined and Higher. Defined means that we can define certain timeframe for fibonacci levels calculation. Higher means that indicator calculates fibonacci levels from higher timeframe. Example : current timeframe is M15 then fibonacci levels is from M30. Current timeframe is H1 then fibonacci levels is from H4,etc.
In case Select Timeframe = Defined then we need to define timeframe below
Timeframe = determine timeframe here. It can be from M1 to Monthly
Slow Period = Slower Period of Trend
Fast Period = Faster Period Of Trend
Reward Ratio = Indicator will automatically calculate SL in pips and in this case we can set reward ratio to show on the chart
Show Fibo Lines = Show /Hide Fibo Levels
Up Area Color = Golden area color for uptrend
Down Area Color = Golden area color for downtrend
Up Line Color = Fibo level color for uptrend
Down Line Color = Fibo level color for downtrend
Up Text Color = Text color for uptrend
Down Text Color = Text color for downtrend
Minimum Signal strength to Alert = Minimum value of Strength power levels for indicator to alert
— Below is input true/false for alert. —
PopUp Alert
Mobile Notification Alert
Email Alert
HOW TO TRADE
There are 3 kind of arrows on the chart. Arrows,circles and stars. Arrows provide entry momentum ,circles indicate highest/lowest price in the faster period and stars is to ensure that price currently oversold /overbought . Then 2 colors “template” : Blue and Red that we can change thru external inputs , is a trend. By default , blue is uptrend and red is downtrend.
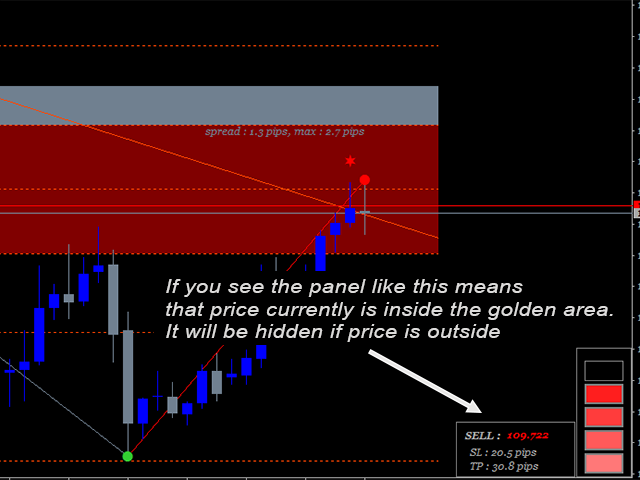
Trendlines as a support and resistant line (see images ) and ‘Power Bars Level’ in the bottom right as an indication of signal strength.
We provide the recommendation of maximum spread value for current market condition. Maximum spread value is recommended as long you are using SL value provided by indicator because the SL is calculated by range of current fibo level. It may be high possibility to reach stoploss other than takeprofit when spread is too high .
Below is the details of entry buy rules. Simply do vise versa for entry sell.
BUY RULES
1. Uptrend. By default color is Blue.
2. Last Arrow color is lime
3. Last Circle color is lime
4. Last Star color is lime
5. Price is in ‘ Golden area’ . Where the golden area is the blue rectangle. In this case price is Ask for buy and Bid for Sell
6. Minimum Power strength level bars = 4
For stronger signal we can do these below:
7. There is at least 1 long bullish /marubozu/ any other other bullish candle patterns before vertical line. See image
8. There is not long bearish/marubozu/ any other other bearish candle patterns after vertical line. See image. Small candles in the last is better.
9. There is not candle close below gray rectangle after vertical line.
Please watch video for more details
OR WE CAN SIMPLY FOLLOW THE ALERT. All rules above are summarized by alert. You can set minimum power level for indicator to alert you.
![图片[1]-Golden Retracement Power 外汇EA-EA侦探社 - 全球领先的MQL5官网外汇EA机器人MT4自动化交易EA资源免费分享网站](https://www.mql5.vip/wp-content/uploads/2024/05/20240514135753-66436de186e38.png)
![图片[2]-Golden Retracement Power 外汇EA-EA侦探社 - 全球领先的MQL5官网外汇EA机器人MT4自动化交易EA资源免费分享网站](https://www.mql5.vip/wp-content/uploads/2024/05/20240514135753-66436de1c4a56.png)
![图片[3]-Golden Retracement Power 外汇EA-EA侦探社 - 全球领先的MQL5官网外汇EA机器人MT4自动化交易EA资源免费分享网站](https://www.mql5.vip/wp-content/uploads/2024/05/20240514135754-66436de202f45.png)
![图片[4]-Golden Retracement Power 外汇EA-EA侦探社 - 全球领先的MQL5官网外汇EA机器人MT4自动化交易EA资源免费分享网站](https://www.mql5.vip/wp-content/uploads/2024/05/20240514135754-66436de23813a.png)
![图片[5]-Golden Retracement Power 外汇EA-EA侦探社 - 全球领先的MQL5官网外汇EA机器人MT4自动化交易EA资源免费分享网站](https://www.mql5.vip/wp-content/uploads/2024/05/20240514135754-66436de26f401.png)
![图片[6]-Golden Retracement Power 外汇EA-EA侦探社 - 全球领先的MQL5官网外汇EA机器人MT4自动化交易EA资源免费分享网站](https://www.mql5.vip/wp-content/uploads/2024/05/20240514135754-66436de2a8ab5.png)
![图片[7]-Golden Retracement Power 外汇EA-EA侦探社 - 全球领先的MQL5官网外汇EA机器人MT4自动化交易EA资源免费分享网站](https://www.mql5.vip/wp-content/uploads/2024/05/20240514135754-66436de2d11f7.png)
![图片[8]-Golden Retracement Power 外汇EA-EA侦探社 - 全球领先的MQL5官网外汇EA机器人MT4自动化交易EA资源免费分享网站](https://www.mql5.vip/wp-content/uploads/2024/05/20240514135755-66436de303d40.png)