Buy a Coffee for Yuniesky Carralero Cuellar
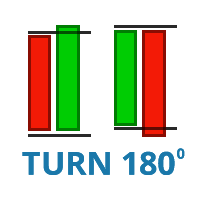
This indicator draws the RED – GREEN and GREEN – RED candlestick pattern, the green candles that close above their previous red candle, and the red candles closing below your previous green candle.
https://www.youtube.com/watch?v=UAW-fIyV-0U&t=1154s
Input Parameters
1. RED – GREEN: Draw the green candles that close above their previous red candle.
2. GREEN – RED: Draw the red candles that close below their previous green candle.
3. PREV CANDLE: Draw previous candle.
4. RED – RED / GREEN – GREEN: Shows the green candles that close above its previous green candle and also shows the red candles that close below its previous red candle.
5. M20 ABOVE / BELOW: Draw only the RED-GREEN candles with low higher than M20 and the GREEN-RED candles with high lower than M20.
6. M20 INC / DEC: Draw only RED-GREEN candles with M20 sloping and GREEN-RED candles with M20 declining.
7. M20 NEAR: Show only GREEN-RED candles with high or RED-GREEN candles with low near M20.
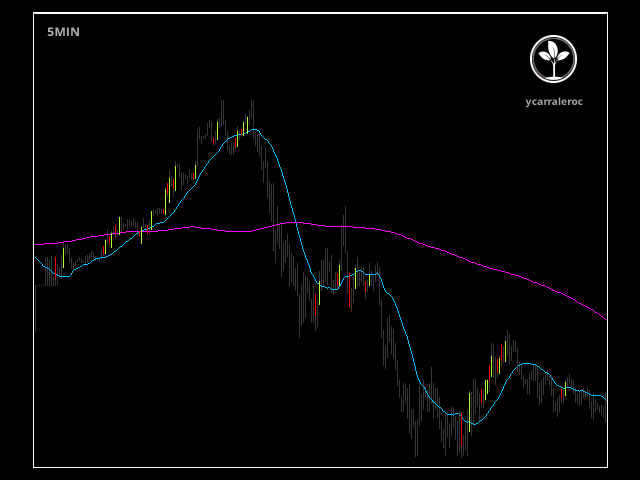
You will need to use the A4_P template that shows
1. Simple Moving Average 20
2. Simple Moving Average 200
3. Period Separators
4. ASK line
Support
I will be happy to hear your recommendations to improve this product.
Author
Yuniesky Carralero Cuellar, Computer Scientist
![图片[1]-Turn 180 外汇EA-EA侦探社 - 全球领先的MQL5官网外汇EA机器人MT4自动化交易EA资源免费分享网站](https://www.mql5.vip/wp-content/uploads/2024/05/20240514142249-664373b98327e.jpg)


