
|
如果免费资源下载的文件为TXT文档 请联系站长更新!站长微信:Lv596999 Telegram:@eapoj “Mql5官网”板块的EA基本都有,大部分是无限制NODLL版,NODLL版本MT1420升级,大多数不可用!这些EA来源为国外花钱买过来的 如有需要,请联系站长! “EA测评”板块资源全部现有,看见不错的,可以联系站长,看EA在确定是否收费。 “无限制EA”板块,大部分免费,下载文件全部存在,都可以免费下载。 站长硬盘EA太多,因大部分时间做交易,做风控,没太多时间更新下载地址,请谅解! 需要更新下载文件,请联系站长微信!国外朋友请联系Telegram。  |
Do you like scalping? This indicator displays information about the latest price quotes received from the broker.
[ Installation
Guide | Update
Guide | Troubleshooting
| FAQ
| All
Products ]
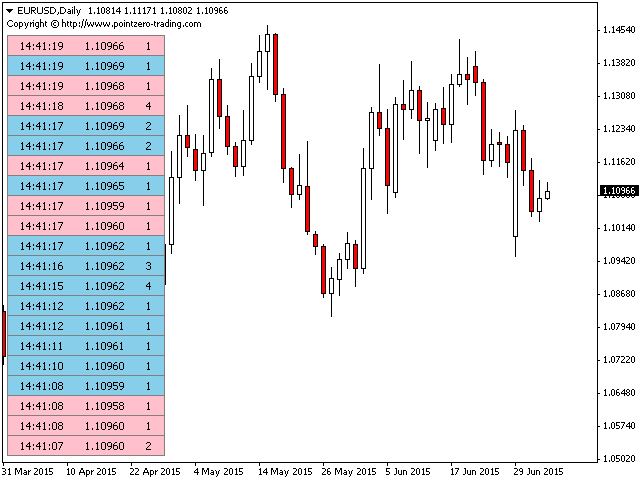
- Identify tick trends easily
- A blue row means the price has increased
- A red row means the price has decreased
- Customizable colors and font sizes
- Display your desired amount of rows
- The indicator is non-repainting
Parameters
- Rows: amount of rows with data to display in the chart
- Font size: font size of the tick data displayed in the chart
- Font bold: made the font bold or regular
- Row height ratio: height of the rows displayed in the chart
- Bullish color: color of upticks
- Bearish color: color of downticks
- Border color: color of rows borders
- Neutral color: color for a row that has the same tick as last quote
- Transparency: From 0 to 255, makes rows transparent
Support
I am happy to provide free products but given my limited time, they come without support of any kind. My apologies.
Author
Arturo López Pérez, private investor and speculator, software engineer and founder of Point Zero Trading Solutions.
© 版权声明
文章版权归作者所有,未经允许请勿转载。
THE END


