
|
如果免费资源下载的文件为TXT文档 请联系站长更新!站长微信:Lv596999 Telegram:@eapoj “Mql5官网”板块的EA基本都有,大部分是无限制NODLL版,NODLL版本MT1420升级,大多数不可用!这些EA来源为国外花钱买过来的 如有需要,请联系站长! “EA测评”板块资源全部现有,看见不错的,可以联系站长,看EA在确定是否收费。 “无限制EA”板块,大部分免费,下载文件全部存在,都可以免费下载。 站长硬盘EA太多,因大部分时间做交易,做风控,没太多时间更新下载地址,请谅解! 需要更新下载文件,请联系站长微信!国外朋友请联系Telegram。  |
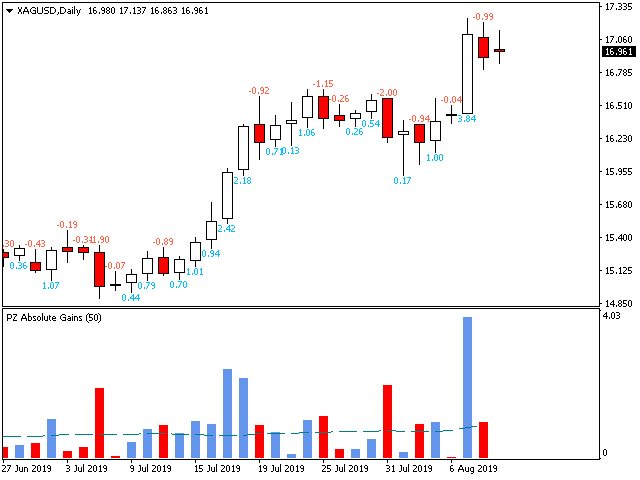
This indicator calculates how much has an instrument won or lost in percentage terms on each bar displayed in the chart.
[ Installation
Guide | Update
Guide | Troubleshooting
| FAQ
| All
Products ]
- Identify market patterns
- Find decisive price movements
- Be suspicious about overbought/oversold situations
It is an extremely easy to use indicator…
- The blue histogram represents winning bars
- The red histogram represents losing bars
- The gray line represents the average win/loss per bar
- Labels are plotted on each bar displaying the % win/loss for the bar
…with straightforward trading implications, depending your trading approach.
- You can buy after an oversold bar takes place
- You can short after an overbought bar takes place
- You can buy after a decisive winning bar
- You can short after a decisive losing bar
Input Parameters
- Max History Bars: Number of bars to evaluate when the indicator is loaded
- MA Period: Averaging period to calculate the average price movement in the oscillator
Support
I am happy to provide free products but given my limited time, they come without support of any kind. My apologies.
Author
Arturo López Pérez, private investor and speculator, software engineer and founder of Point Zero Trading Solutions.
![图片[1]-PZ Absolute Gains 外汇EA-EA侦探社 - 全球领先的MQL5官网外汇EA机器人MT4自动化交易EA资源免费分享网站](https://www.mql5.vip/wp-content/uploads/2024/05/20240514151811-664380b3b95ae.png)
![图片[2]-PZ Absolute Gains 外汇EA-EA侦探社 - 全球领先的MQL5官网外汇EA机器人MT4自动化交易EA资源免费分享网站](https://www.mql5.vip/wp-content/uploads/2024/05/20240514151812-664380b40450f.png)
![图片[3]-PZ Absolute Gains 外汇EA-EA侦探社 - 全球领先的MQL5官网外汇EA机器人MT4自动化交易EA资源免费分享网站](https://www.mql5.vip/wp-content/uploads/2024/05/20240514151812-664380b4418e5.png)