
|
如果免费资源下载的文件为TXT文档 请联系站长更新!站长微信:Lv596999 Telegram:@eapoj “Mql5官网”板块的EA基本都有,大部分是无限制NODLL版,NODLL版本MT1420升级,大多数不可用!这些EA来源为国外花钱买过来的 如有需要,请联系站长! “EA测评”板块资源全部现有,看见不错的,可以联系站长,看EA在确定是否收费。 “无限制EA”板块,大部分免费,下载文件全部存在,都可以免费下载。 站长硬盘EA太多,因大部分时间做交易,做风控,没太多时间更新下载地址,请谅解! 需要更新下载文件,请联系站长微信!国外朋友请联系Telegram。  |
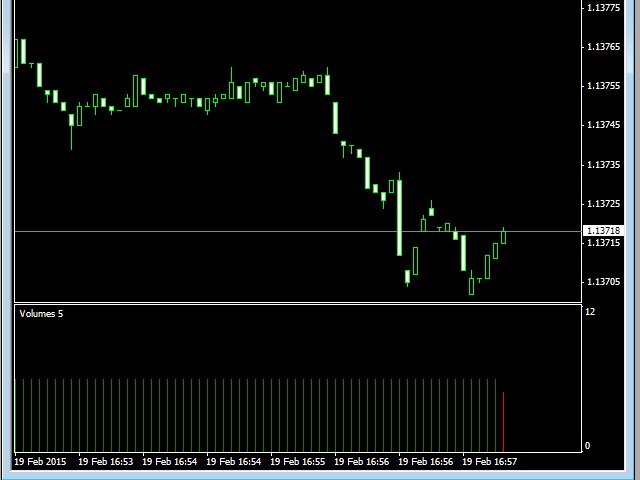
Tick Volume Chart — fixed volume bars for MetaTrader 4.
The utility creates charts on which each candle has a fixed tick volume. Data sampling is carried out not by time but by the tick volume. Each bar contains a given (fixed) tick volume. Tick volume can be adjusted by changing the value of the Volume parameter. You can apply indicators, Expert Advisors and scripts to the tick chart. You get a fully functional chart, on which you can work just as well as on a regular chart.
In the process of work, history accumulates. If necessary, you can reset (delete the accumulated history). It is useful in the formation of the chart with a different tick volume. To perform a reset, delete a global variable having the name of the appropriate trading tools. There is a special window in terminal that manages global variables. It can be opened by execution of the “Tools — Global Variables” menu command or by pressing F3.
At the same time the data is updated synchronously with the basic chart with no delays.
You can simultaneously create several charts.
Inputs
- Volume — tick volume.
- Chart — timeframe for a chart opened in a separate window. In case you are going to work with a single chart for the currency pair, the timeframe is irrelevant. Timeframe does not affect the calculations during the chart creation. This setup is created to open several charts for the same currency pair, but with different settings. In such case, different timeframes for each chart (for example, M2, M3, M4) should be set. You also need to set different timeframes when simultaneously running the Tick Volume Chart indicator and other tools that generate a synthetic chart on the same currency pair.
Launch
- Open the “Navigator” window.
- Find the “Tick Volume Chart” and drag it to the desired chart (any timeframe).
- Open the resulting chart by clicking the corresponding “Open chart” button.