
|
如果免费资源下载的文件为TXT文档 请联系站长更新!站长微信:Lv596999 Telegram:@eapoj “Mql5官网”板块的EA基本都有,大部分是无限制NODLL版,NODLL版本MT1420升级,大多数不可用!这些EA来源为国外花钱买过来的 如有需要,请联系站长! “EA测评”板块资源全部现有,看见不错的,可以联系站长,看EA在确定是否收费。 “无限制EA”板块,大部分免费,下载文件全部存在,都可以免费下载。 站长硬盘EA太多,因大部分时间做交易,做风控,没太多时间更新下载地址,请谅解! 需要更新下载文件,请联系站长微信!国外朋友请联系Telegram。  |
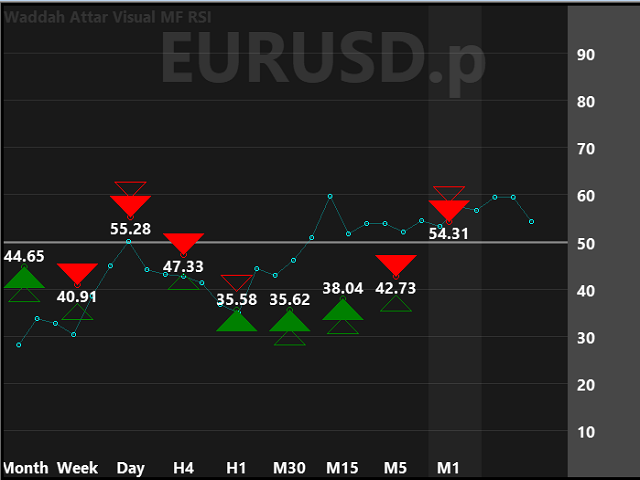
Waddah Attar Visual MF RSI
this App show you RSI values and status for all frames in one chart .
Filled Triangle means current RSI Value .
Framed Triangle means previous RSI Value .
Up Arrow and Green Color means the direction of RSI is up .
Down Arrow and Red Color means the direction of RSI is down .
when you move mouse cursor on frame column .. the full RSI chart will drawn .
you can change RSI Period in the app properties .. the default is 14 .
thanks and good luck .
![图片[1]-Waddah Attar Visual MF RSI 外汇EA-EA侦探社 - 全球领先的MQL5官网外汇EA机器人MT4自动化交易EA资源免费分享网站](https://www.mql5.vip/wp-content/uploads/2024/05/20240514155532-664389740d1e9.png)
© 版权声明
文章版权归作者所有,未经允许请勿转载。
THE END


