|
如果免费资源下载的文件为TXT文档 请联系站长更新!站长微信:Lv596999 Telegram:@eapoj “Mql5官网”板块的EA基本都有,大部分是无限制NODLL版,NODLL版本MT1420升级,大多数不可用!这些EA来源为国外花钱买过来的 如有需要,请联系站长! “EA测评”板块资源全部现有,看见不错的,可以联系站长,看EA在确定是否收费。 “无限制EA”板块,大部分免费,下载文件全部存在,都可以免费下载。 站长硬盘EA太多,因大部分时间做交易,做风控,没太多时间更新下载地址,请谅解! 需要更新下载文件,请联系站长微信!国外朋友请联系Telegram。  |
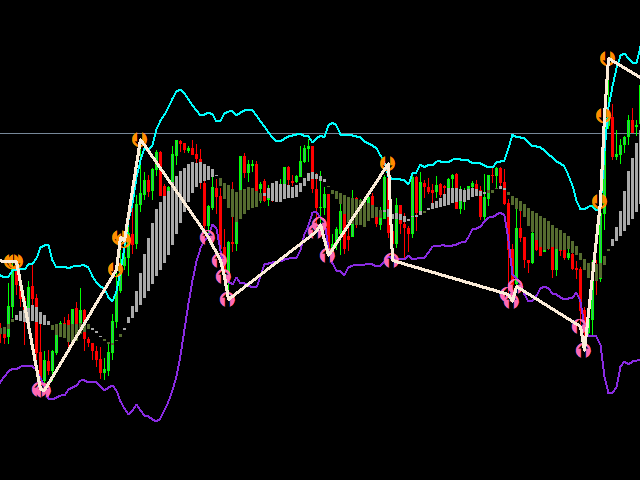
■Introduction This Indicator Is Based On Average Price/Maximum Price Moves, And Using Moving Bollinger Bands And Moving Averages.
■The Advantage Of Using It With YOUR own Analysis Will Confirm Potential Supports And Resistances While it Compliments With Your Analysis
■The Indicator Is Non-Repainting
■AND Along With Our Special Trend METRE that Changes With The Conditions OF A Bullish Or Bearish Trend….
Recommend Time-Frames:■H1 ■H4■M15
Usage:■The Indicator Is Very Profitable If Used Accordingly.■Before Taking A Trade In This Case A Buy Trade…An Arrow For Buy Trade Must Be Visualized By The Indicator And The Canndles Must Be Above The Trend Indicator Meter(MACD) On The Main Chart.■Enter After Candle Closes & Sl Should Be Based On Your Price Action Analysis Or It Can Be Above Your Bollinger Band Afrter Getting A Signal
■Regards I Hope You Will Try Out This Indicator As I wish You All The Best.. Wins And Losses In The Use Of This Indicator Should Lead To Profits In The End Of Each Day.