
|
如果免费资源下载的文件为TXT文档 请联系站长更新!站长微信:Lv596999 Telegram:@eapoj “Mql5官网”板块的EA基本都有,大部分是无限制NODLL版,NODLL版本MT1420升级,大多数不可用!这些EA来源为国外花钱买过来的 如有需要,请联系站长! “EA测评”板块资源全部现有,看见不错的,可以联系站长,看EA在确定是否收费。 “无限制EA”板块,大部分免费,下载文件全部存在,都可以免费下载。 站长硬盘EA太多,因大部分时间做交易,做风控,没太多时间更新下载地址,请谅解! 需要更新下载文件,请联系站长微信!国外朋友请联系Telegram。  |
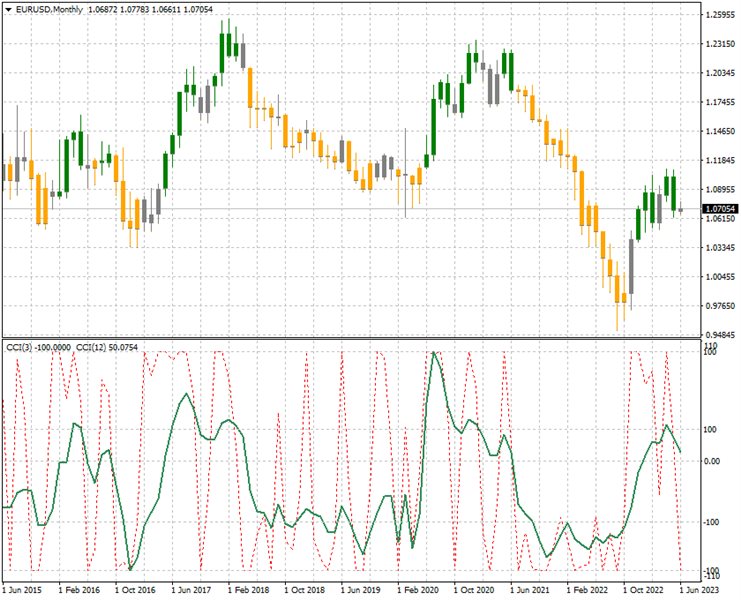
The indicator colors candlesticks of the price chart in accordance with the data of two CCI indicators from different timeframes.
If both CCI indicators are above 0, the indicator paints the candle in the color that signals about price growth, and vice versa.
The indicator allows to efficiently follow the trend, track short-term price rollbacks, and also to identify price reversals.
The indicator does not redraw.
Settings
- CCI1_Period ( >1) – period of the fast CCI osc;
- CCI1_Price – price of the fast CCI osc;
- CCI2_Period (>CCI1_Period) – period of the slow CCI osc;
- CCI2_Price – price of the slow CCI osc.
![图片[1]-CCI Candles 2 AM 外汇EA-EA侦探社 - 全球领先的MQL5官网外汇EA机器人MT4自动化交易EA资源免费分享网站](https://www.mql5.vip/wp-content/uploads/2024/05/20240514184018-6643b01211519.jpg)
![图片[2]-CCI Candles 2 AM 外汇EA-EA侦探社 - 全球领先的MQL5官网外汇EA机器人MT4自动化交易EA资源免费分享网站](https://www.mql5.vip/wp-content/uploads/2024/05/20240514184018-6643b0123dcbf.jpg)
© 版权声明
文章版权归作者所有,未经允许请勿转载。
THE END


