
|
如果免费资源下载的文件为TXT文档 请联系站长更新!站长微信:Lv596999 Telegram:@eapoj “Mql5官网”板块的EA基本都有,大部分是无限制NODLL版,NODLL版本MT1420升级,大多数不可用!这些EA来源为国外花钱买过来的 如有需要,请联系站长! “EA测评”板块资源全部现有,看见不错的,可以联系站长,看EA在确定是否收费。 “无限制EA”板块,大部分免费,下载文件全部存在,都可以免费下载。 站长硬盘EA太多,因大部分时间做交易,做风控,没太多时间更新下载地址,请谅解! 需要更新下载文件,请联系站长微信!国外朋友请联系Telegram。  |
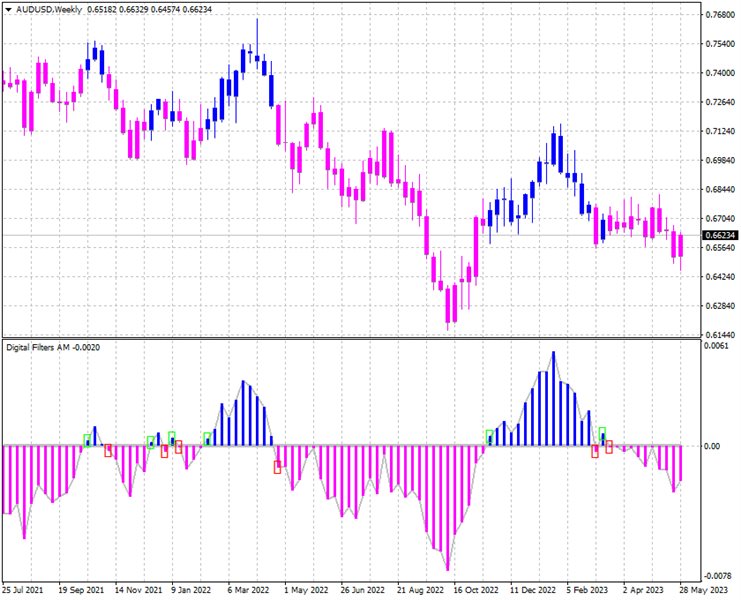
This indicator displays candle prices on the chart, colored in accordance with the data of the SATL digital filter built on closing prices.
The indicator has no configurable parameters.
Allows you to effectively follow a long-term trend.
Usage:
- After the full formation of a candle colored in the opposite color to the previous candle, place a stop order at the high / low of such a candle.
- When the price overcomes such a high/low, a position will be opened.
- With the full formation of a candle painted in the opposite color, you should consider options for exiting the position or placing a stop order to close the position at the high / low of such a candle.
![图片[1]-SATL Candles 2 AM 外汇EA-EA侦探社 - 全球领先的MQL5官网外汇EA机器人MT4自动化交易EA资源免费分享网站](https://www.mql5.vip/wp-content/uploads/2024/05/20240514184419-6643b1033d149.jpg)
![图片[2]-SATL Candles 2 AM 外汇EA-EA侦探社 - 全球领先的MQL5官网外汇EA机器人MT4自动化交易EA资源免费分享网站](https://www.mql5.vip/wp-content/uploads/2024/05/20240514184420-6643b1041158a.jpg)
© 版权声明
文章版权归作者所有,未经允许请勿转载。
THE END


