See what’s happening across the entire market in different time frames with just a glance!
This fully-responsive dashboard enables you to understand the current situation of the market without needing to check different charts.
It visualizes the current value of three standard-scaled indicators (RSI, Stochastic and ADX) for your preferred symbol and time frames.
You can even design some new trading strategies based on the insights it provides.
Key features:
- Clicking on each dashboard cell opens a chart with the corresponding symbol-time frame, using any template you prefer.
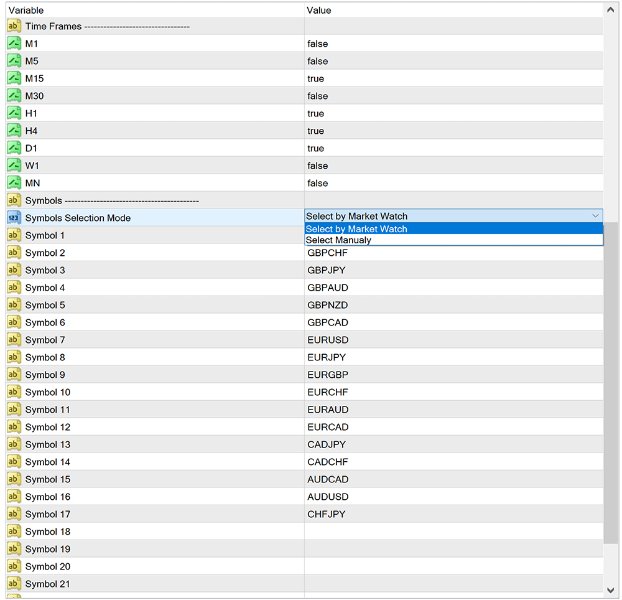
- You can select your preferred symbols manually or by your market watch.
- The dashboard size adjusts immediately according to changes in the chart.
- You can customize settings including Indicators inputs, Oversold-Overbought limits and their color, background color and many other visual properties.
Want to read more? I have a better suggestion: Apply it on your chart and see how you can exploit its opportunities and effectiveness.
![图片[1]-Market Visualizer 外汇EA-EA侦探社 - 全球领先的MQL5官网外汇EA机器人MT4自动化交易EA资源免费分享网站](https://www.mql5.vip/wp-content/uploads/2024/05/20240514193816-6643bda89f910.jpg)
![图片[2]-Market Visualizer 外汇EA-EA侦探社 - 全球领先的MQL5官网外汇EA机器人MT4自动化交易EA资源免费分享网站](https://www.mql5.vip/wp-content/uploads/2024/05/20240514193816-6643bda8ebedd.jpg)
![图片[3]-Market Visualizer 外汇EA-EA侦探社 - 全球领先的MQL5官网外汇EA机器人MT4自动化交易EA资源免费分享网站](https://www.mql5.vip/wp-content/uploads/2024/05/20240514193817-6643bda93f417.jpg)
![图片[4]-Market Visualizer 外汇EA-EA侦探社 - 全球领先的MQL5官网外汇EA机器人MT4自动化交易EA资源免费分享网站](https://www.mql5.vip/wp-content/uploads/2024/05/20240514193817-6643bda98a3ae.jpg)
![图片[5]-Market Visualizer 外汇EA-EA侦探社 - 全球领先的MQL5官网外汇EA机器人MT4自动化交易EA资源免费分享网站](https://www.mql5.vip/wp-content/uploads/2024/05/20240514193817-6643bda9d6685.jpg)
![图片[6]-Market Visualizer 外汇EA-EA侦探社 - 全球领先的MQL5官网外汇EA机器人MT4自动化交易EA资源免费分享网站](https://www.mql5.vip/wp-content/uploads/2024/05/20240514193818-6643bdaa18388.jpg)

© 版权声明
文章版权归作者所有,未经允许请勿转载。
THE END


