
|
如果免费资源下载的文件为TXT文档 请联系站长更新!站长微信:Lv596999 Telegram:@eapoj “Mql5官网”板块的EA基本都有,大部分是无限制NODLL版,NODLL版本MT1420升级,大多数不可用!这些EA来源为国外花钱买过来的 如有需要,请联系站长! “EA测评”板块资源全部现有,看见不错的,可以联系站长,看EA在确定是否收费。 “无限制EA”板块,大部分免费,下载文件全部存在,都可以免费下载。 站长硬盘EA太多,因大部分时间做交易,做风控,没太多时间更新下载地址,请谅解! 需要更新下载文件,请联系站长微信!国外朋友请联系Telegram。  |
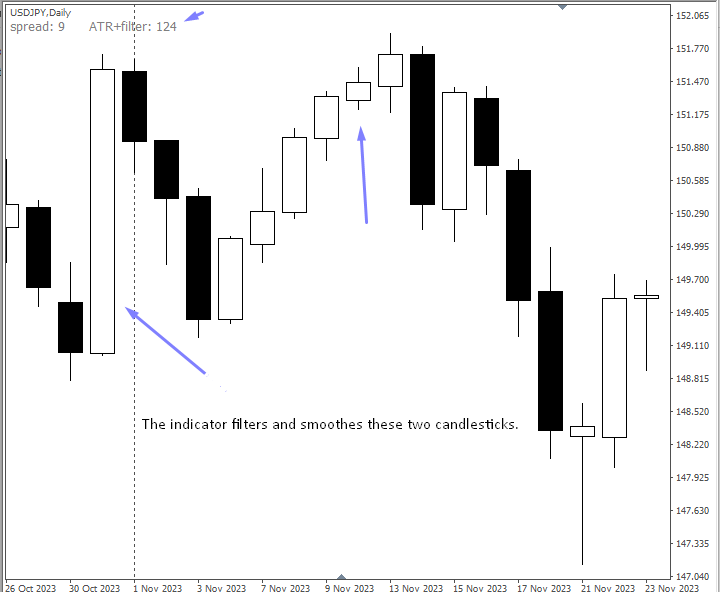
The indicator displays information on the chart about the average number of points per day the price of the instrument and the spread.
It differs from analogues in that it does not take into account huge or insignificant daily fluctuations, they are smoothed out, so in any situation it allows you to see the real picture, not distorted by random news bursts or days with “near zero” trading activity.
How can the indicator be useful?
1. Assistance in choosing charts for trading with the required volatility.
2. Correct calculation of stop loss and take profit for intraday trading. Each trading instrument has its own average daily power reserve and up-to-date information about it is necessary for the correct calculation of goals before entering a position.
In the settings, you can change the number of days to calculate the average size of the daily candle (“Days” by default is 5 days), the color of the displayed text (“Color”) and the number of the corner of the terminal in which the indicator will be displayed (“Corner” from 1 to 4).