
|
如果免费资源下载的文件为TXT文档 请联系站长更新!站长微信:Lv596999 Telegram:@eapoj “Mql5官网”板块的EA基本都有,大部分是无限制NODLL版,NODLL版本MT1420升级,大多数不可用!这些EA来源为国外花钱买过来的 如有需要,请联系站长! “EA测评”板块资源全部现有,看见不错的,可以联系站长,看EA在确定是否收费。 “无限制EA”板块,大部分免费,下载文件全部存在,都可以免费下载。 站长硬盘EA太多,因大部分时间做交易,做风控,没太多时间更新下载地址,请谅解! 需要更新下载文件,请联系站长微信!国外朋友请联系Telegram。  |
What are Heiken Ashi Candles?
Heiken Ashi, derived from the Japanese term ‘Heikin Ashi,’ translates to average price bars. It’s an indicator depicting price bars on a chart.
Formula for Heiken Ashi candles:
– Heiken Ashi opening price: (previous candle’s opening + closing price) / 2 – Closing price Heiken Ashi: (opening + high + low + closing) / 4 – Heiken Ashi peak: Max of high, opening, or closing price – Heiken Ashi bottom price: Min of low, opening, or closing price
How to Read Heiken Ashi Chart?
Four main signals for trend and trading analysis:
1. Blue candles indicate an uptrend, suggesting buying or exiting sell orders. 2. Small-bodied candles with upper and lower shadows signal a possible trend change, acting as a decision point. Enter early for trend prediction or wait for more signals. 3. Red candles signify a downtrend, prompting selling or exiting buy orders. 4. Red candles with no upper shadow indicate a robust downtrend, advising continued selling until the trend reverses.
Using Heiken Ashi MT4 Candles
Trading with Heiken Ashi on MT4:
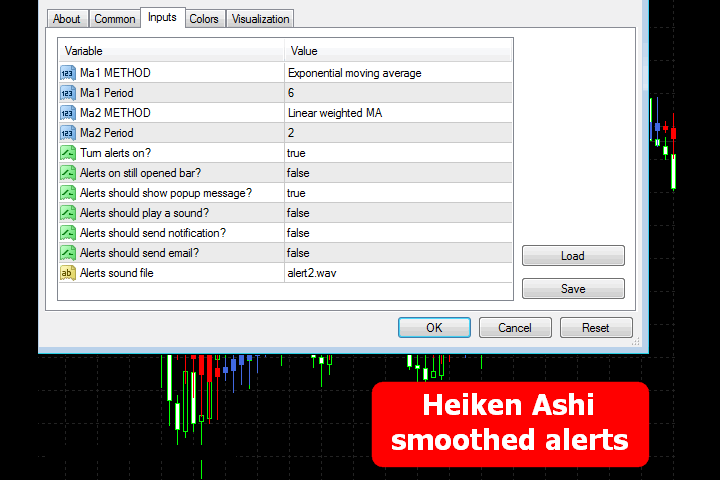
– Blue indicates an uptrend, suggesting buying. – Red indicates a downtrend, suggesting selling. – Buy after the first closed blue candle; sell after the first closed red candle. – Combine with candlestick patterns, price trends, and support/resistance for optimal entry areas.![图片[1]-Mql5官网 HeikenAshi Smoothed Alerts 外汇EA-EA侦探社 - 全球领先的MQL5官网外汇EA机器人MT4自动化交易EA资源免费分享网站](https://www.mql5.vip/wp-content/uploads/2024/05/20240516145022-66461d2eef214.jpg)
![图片[2]-Mql5官网 HeikenAshi Smoothed Alerts 外汇EA-EA侦探社 - 全球领先的MQL5官网外汇EA机器人MT4自动化交易EA资源免费分享网站](https://www.mql5.vip/wp-content/uploads/2024/05/20240516145023-66461d2f7a722.jpg)