
|
如果免费资源下载的文件为TXT文档 请联系站长更新!站长微信:Lv596999 Telegram:@eapoj “Mql5官网”板块的EA基本都有,大部分是无限制NODLL版,NODLL版本MT1420升级,大多数不可用!这些EA来源为国外花钱买过来的 如有需要,请联系站长! “EA测评”板块资源全部现有,看见不错的,可以联系站长,看EA在确定是否收费。 “无限制EA”板块,大部分免费,下载文件全部存在,都可以免费下载。 站长硬盘EA太多,因大部分时间做交易,做风控,没太多时间更新下载地址,请谅解! 需要更新下载文件,请联系站长微信!国外朋友请联系Telegram。  |
DYJ T3ModeMA基于T3算法。 T3算法是在美国杂志《TASC》发表的文章《更好的移动平均线》中被引入技术分析领域的。
T3可以平滑价格序列,同时减少趋势跟踪系统的典型滞后。
该指标的柱形线尺寸决定入场信号,当柱形线尺寸趋于0时,则是趋势转折点。
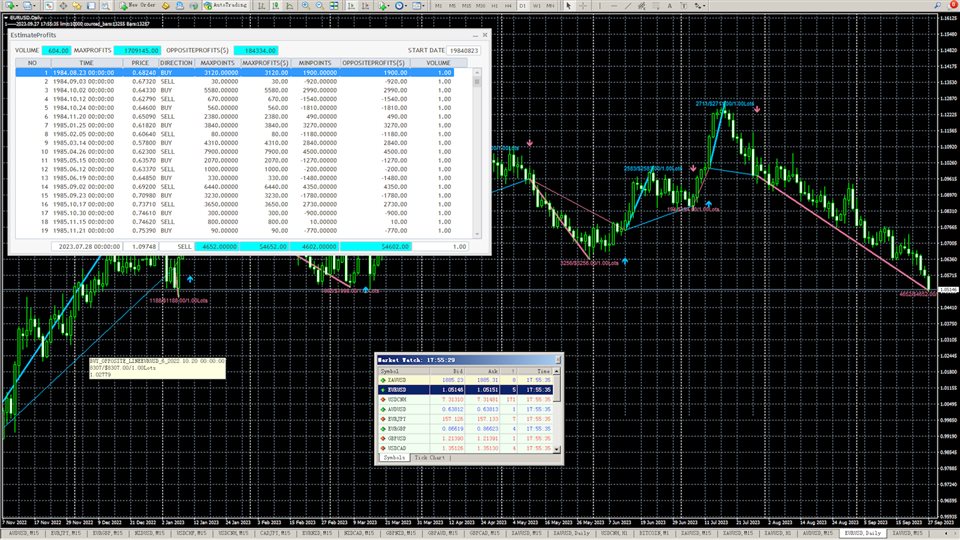
该指标使用模拟交易技术,
指标为你提供评价开盘信号和收盘信号整体盈利。
你用哪种评估模式交易都很方便。
当你选择最大利润模型评估模型时, 建议您使用跟踪止损功能。 这样可以最大程度的跟踪趋势利润。
当您选择反向信号关闭评估模式时, 建议你耐心等待反信号出现,然后关闭仓位。 这个可以一直等趋势真正结束并盈利。
如果您需要自动化跟随指标开仓关仓,请下载实用工具软件DYJ Follow Me
Input
[Indicator]
InpMaMetod = 2 — Moving Average method(0~3):0-Simple averaging; 1-Exponential averaging; 2-Smoothed averaging;3-Linear-weighted averagin
InpMaPeriod = 6 — MA Period
InpT3Period = 9 — T3 algorithm period
InpT3Hot = 0.70 — T3 Polynomial coefficient
InpShowArrows = true
InpAlertsOn = true
ArrowUpClr = DeepSkyBlue — Arrow Up Color
ArrowDnClr = PaleVioletRed — Arrow Down Color
InpIsDisplayIndicatorLine = true — Display Line Of Indicator
[EstimateProfits]
InpSimulatedVolume = 1 — SimulatedVolume . 0.01Lots or more
InpOnlyOppositeClosedLine = false — Only the OppositeClosed line is displayed.
InpIsDisplayChartText = true — Hide All Text Of Chart
InpIsDisplayProfitsLine = true — Hide All Line Of Chart
MaxProfitsTextHigh = 40 — Maximum profit label height
MaxProfitsTextLow = 20 — Minimum profit label height(opposite)
InpIsEstimateDialog = true — Hide Or Show EstimateDialog
InpModeProfits = ByMaxProfits — ByMaxProfits or ByOppositeClosed
InpStartDate = “19700101” — Statistical start date
![图片[1]-Mql5官网 DYJ T3ModeMA 外汇EA-EA侦探社 - 全球领先的MQL5官网外汇EA机器人MT4自动化交易EA资源免费分享网站](https://www.mql5.vip/wp-content/uploads/2024/05/20240516153504-664627a80494c.jpg)
![图片[2]-Mql5官网 DYJ T3ModeMA 外汇EA-EA侦探社 - 全球领先的MQL5官网外汇EA机器人MT4自动化交易EA资源免费分享网站](https://www.mql5.vip/wp-content/uploads/2024/05/20240516153504-664627a85e3d7.jpg)
![图片[3]-Mql5官网 DYJ T3ModeMA 外汇EA-EA侦探社 - 全球领先的MQL5官网外汇EA机器人MT4自动化交易EA资源免费分享网站](https://www.mql5.vip/wp-content/uploads/2024/05/20240516153504-664627a8b4e02.jpg)
![图片[4]-Mql5官网 DYJ T3ModeMA 外汇EA-EA侦探社 - 全球领先的MQL5官网外汇EA机器人MT4自动化交易EA资源免费分享网站](https://www.mql5.vip/wp-content/uploads/2024/05/20240516153505-664627a91e969.jpg)
![图片[5]-Mql5官网 DYJ T3ModeMA 外汇EA-EA侦探社 - 全球领先的MQL5官网外汇EA机器人MT4自动化交易EA资源免费分享网站](https://www.mql5.vip/wp-content/uploads/2024/05/20240516153505-664627a962181.jpg)
![图片[6]-Mql5官网 DYJ T3ModeMA 外汇EA-EA侦探社 - 全球领先的MQL5官网外汇EA机器人MT4自动化交易EA资源免费分享网站](https://www.mql5.vip/wp-content/uploads/2024/05/20240516153505-664627a999665.jpg)