
|
如果免费资源下载的文件为TXT文档 请联系站长更新!站长微信:Lv596999 Telegram:@eapoj “Mql5官网”板块的EA基本都有,大部分是无限制NODLL版,NODLL版本MT1420升级,大多数不可用!这些EA来源为国外花钱买过来的 如有需要,请联系站长! “EA测评”板块资源全部现有,看见不错的,可以联系站长,看EA在确定是否收费。 “无限制EA”板块,大部分免费,下载文件全部存在,都可以免费下载。 站长硬盘EA太多,因大部分时间做交易,做风控,没太多时间更新下载地址,请谅解! 需要更新下载文件,请联系站长微信!国外朋友请联系Telegram。  |
The EA of Bollinger Bands are a popular technical analysis tool used by traders and investors to analyze price volatility and potential price reversal points in financial markets, such as stocks, forex, or cryptocurrencies. They consist of three lines:
-
The middle band: This is typically a simple moving average (SMA) of the price over a specific period. The most common period used is 20.
-
The upper band: This is the sum of the middle band and twice the standard deviation of the price over the same period as the middle band. The upper band represents the upper volatility boundary.
-
The lower band: This is the difference between the middle band and twice the standard deviation of the price over the same period as the middle band. The lower band represents the lower volatility boundary.
The “Bollinger Band High Distance” typically refers to the distance between the current price and the upper Bollinger Band. This distance can be measured in various ways, but it is often expressed as a multiple of the standard deviation.
Here’s how you can calculate the Bollinger Band High Distance:
-
Calculate the upper Bollinger Band by adding twice the standard deviation to the middle band. Upper Band = Middle Band + (2 * Standard Deviation)
-
Calculate the distance between the current price and the upper Bollinger Band. Bollinger Band High Distance = Current Price – Upper Band
This distance can be positive or negative, indicating whether the current price is above or below the upper Bollinger Band. Traders use this information to assess whether an asset is overbought (when the price is significantly above the upper band) or oversold (when the price is significantly below the lower band).
Bollinger Bands are often used in conjunction with other technical indicators and price action analysis to make trading decisions. Traders may look for potential reversals or trend continuations based on the Bollinger Band High Distance and other factors.
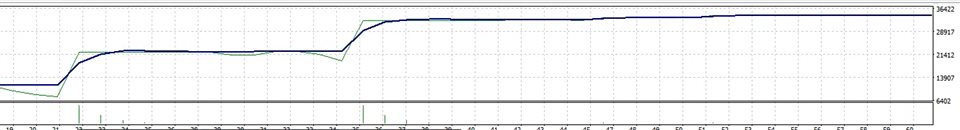
![图片[1]-Mql5官网 EA Bollinger Band High Distance 外汇EA-EA侦探社 - 全球领先的MQL5官网外汇EA机器人MT4自动化交易EA资源免费分享网站](https://www.mql5.vip/wp-content/uploads/2024/05/20240516154522-66462a1277460.jpg)
![图片[2]-Mql5官网 EA Bollinger Band High Distance 外汇EA-EA侦探社 - 全球领先的MQL5官网外汇EA机器人MT4自动化交易EA资源免费分享网站](https://www.mql5.vip/wp-content/uploads/2024/05/20240516154523-66462a133012b.jpg)
![图片[3]-Mql5官网 EA Bollinger Band High Distance 外汇EA-EA侦探社 - 全球领先的MQL5官网外汇EA机器人MT4自动化交易EA资源免费分享网站](https://www.mql5.vip/wp-content/uploads/2024/05/20240516154524-66462a145323e.jpg)
![图片[4]-Mql5官网 EA Bollinger Band High Distance 外汇EA-EA侦探社 - 全球领先的MQL5官网外汇EA机器人MT4自动化交易EA资源免费分享网站](https://www.mql5.vip/wp-content/uploads/2024/05/20240516154525-66462a1535fb7.jpg)